
Your website generates data on everything visitors do — where they came from, what they read, whether they bought. The hard part isn’t collecting those numbers; it’s knowing which ones actually tell you whether the site is working.
Website metrics are the measurable data points that show how a site actually performs and where it loses visitors or revenue. The most-tracked categories are traffic, engagement, conversion, SEO, and site speed, and the right mix of KPIs depends on what a given site is built to do. For your site, the goal is simple: know whether it’s sailing or sinking.
We’ve written this guide to give you the tools and knowledge you need to make it easy. We’ll help you understand why this data is valuable and how to start collecting it for your own website.
Let’s dive into the 20 key metrics you should track to measure your site’s success.
Traffic Metrics
Traffic is like oxygen for your website.
If people aren’t visiting your site, they can’t engage with your content, sign up for your email list, or purchase your products.
Step one for measuring any website is to understand how much traffic is coming and then understand what that traffic is doing once they arrive.
1. Sessions or Users
The top-line metric for understanding your website’s traffic is sessions.
Sessions refer to the number of unique visits to your website.
In other words, it’s the number of times someone (anyone) visited your website in a given period. Think of it like the number of people who walk through the door of a restaurant.
Sessions are closely related to users and pageviews. Users are the number of uniquely identifiable people who come to your website; Pageviews are the number of pages viewed across all sessions by every user. A single user can visit your site more than once (multiple sessions) and look at more than one page (multiple pageviews).
These metrics can often be tracked through your hosting provider. For example, DreamHost’s managed WordPress hosting includes access to this information in your user dashboard.
However, you probably want to track your traffic with an analytics tool like Google Analytics or a custom-built analytics report in Looker Studio (formerly Google Data Studio).
There is no one correct number when it comes to sessions. It will differ radically depending on your goals, audience, and niche.
However, in a general sense, you should be looking for a steady increase in sessions over time, which means your website is growing in visibility and popularity. If you’re not getting the numbers you expect, you may want to look into some of your other traffic metrics to fully understand where the problem lies.
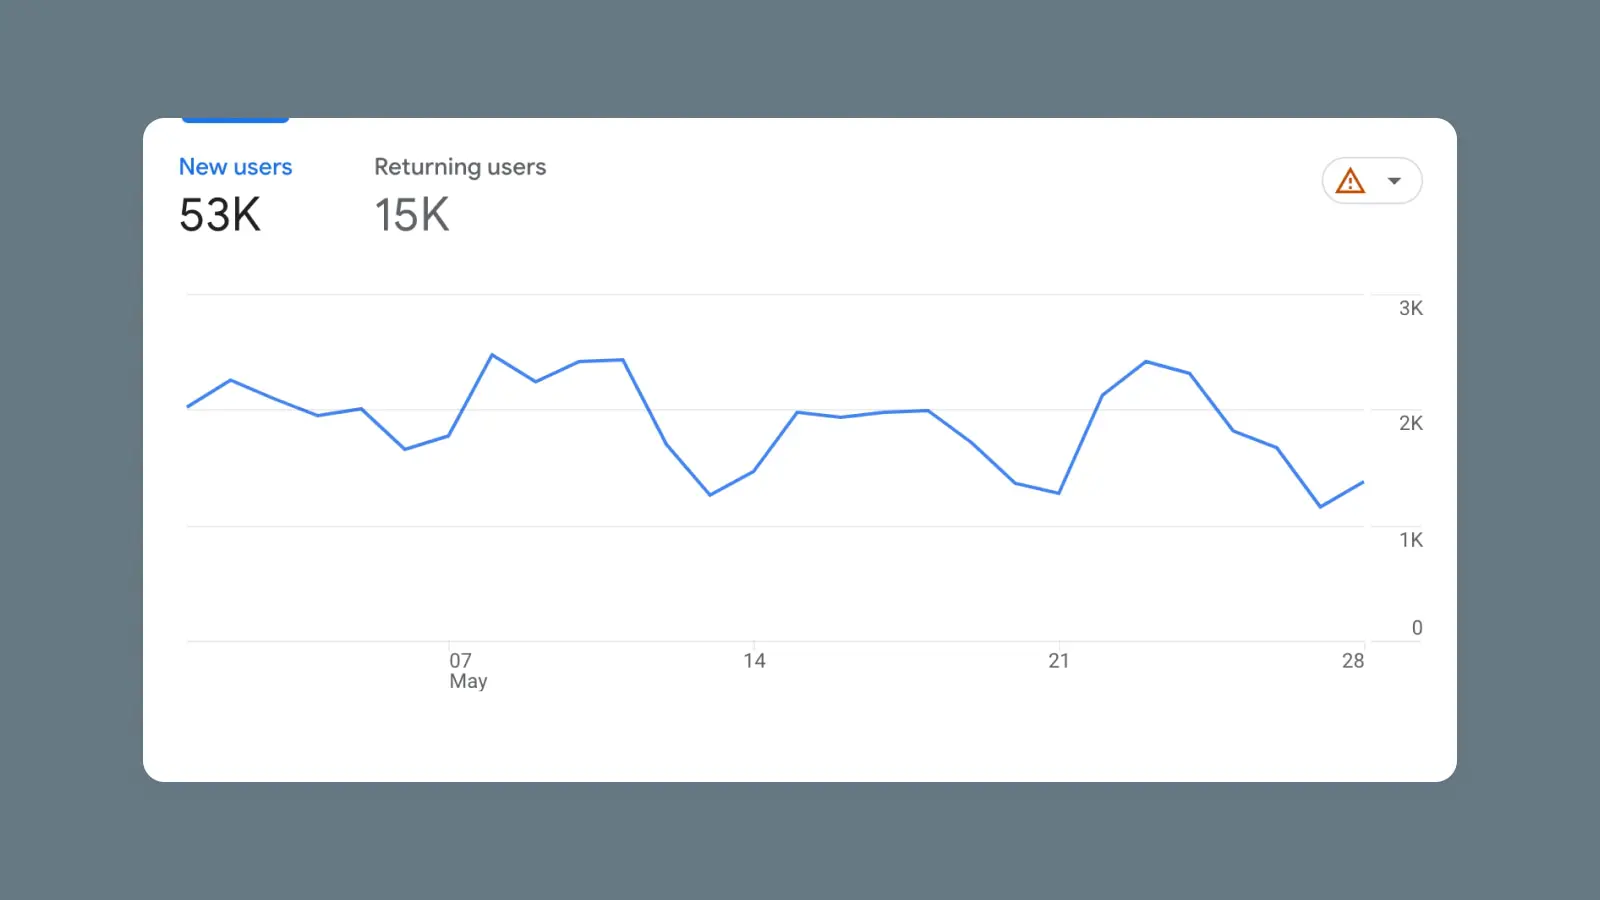
Nerd note: If you really want to go down the rabbit hole here, you can segment your traffic even further. Beyond just looking at sessions, users, and pageviews, you can also look at segments like new users vs. returning users.
Anytime we’re measuring website performance, it’s important to track a single, consistent metric over time rather than jumping between two different data points.
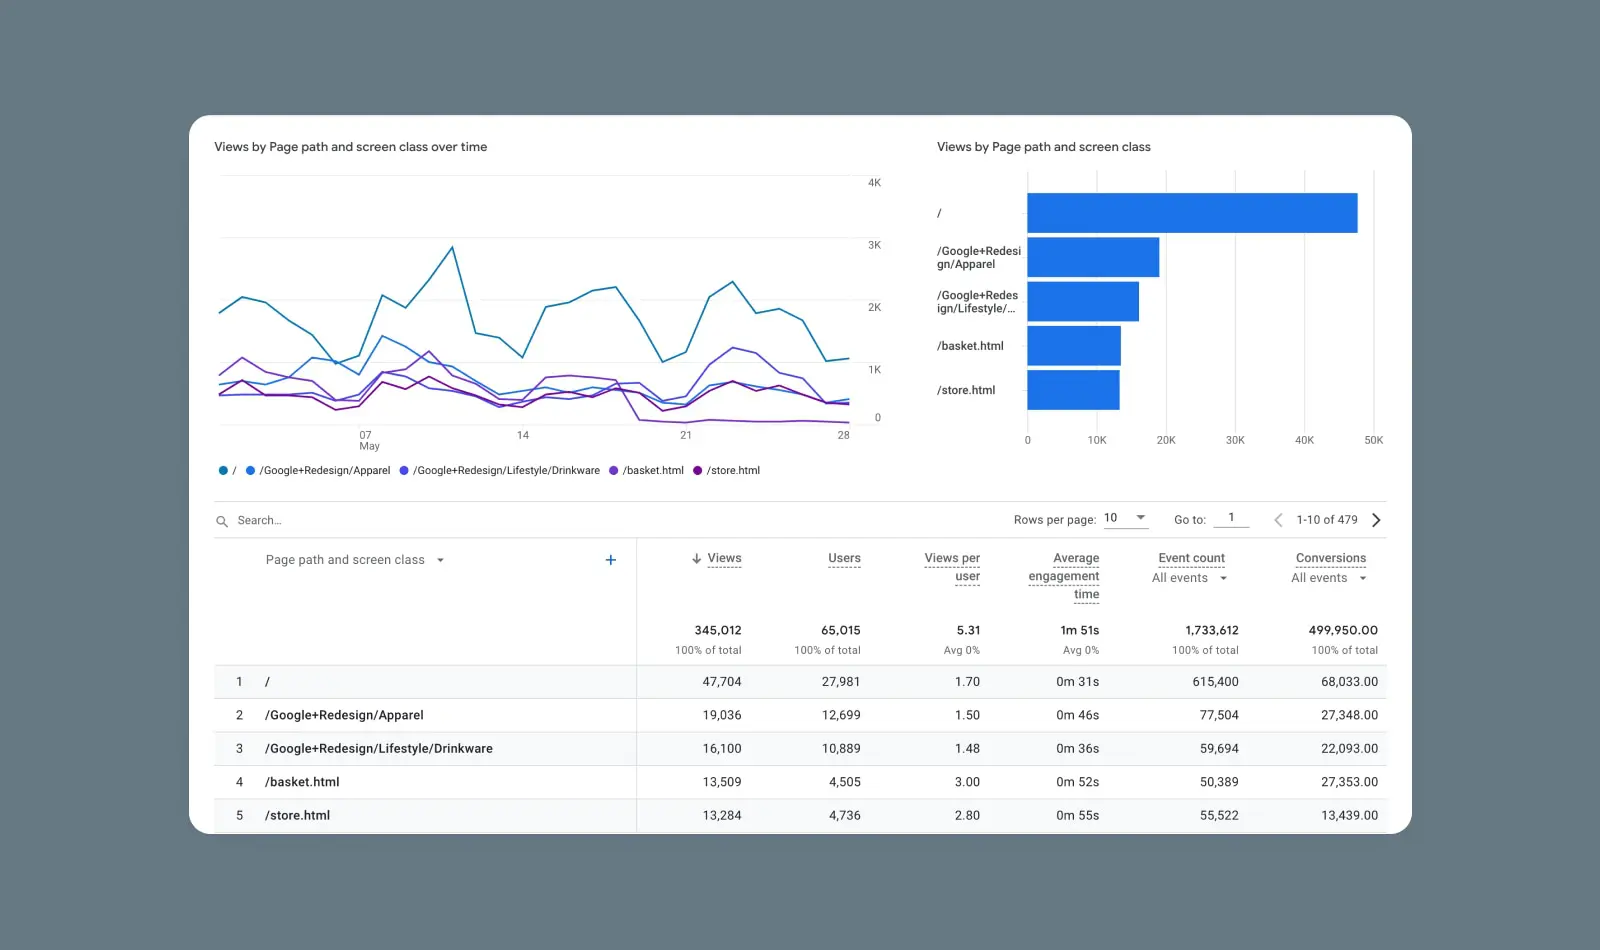
2. Top Pages (By Traffic)
Now, which pages are your website visitors actually viewing?
Another key metric is looking at the top pages on your website, ranked by the amount of traffic (sessions or pageviews) they receive.
Tracking your top pages can tell you what kind of content hits home with your readers and how they find it, which can help you determine where to direct resources or which parts of your website to focus on in the future.
For example, looking at the top pages on your website, you might notice that your audience responds more favorably to video than text-based content.
In that case, you might shift resources to create more videos to grow your site.
Another way you can use Top Pages data is by guiding visitors to content that others have found valuable. If you’re willing to experiment with adding some WordPress plugins to your site, you can even display a “popular posts” section to highlight content based on traffic counts.
Marketing Metrics
Now that we know a bit about how many people visit your site and which pages they visit, we should try to work backward.
What did we do to bring them here?
This is the central question in all of marketing. It’s about understanding what activities you or your marketing team are doing to drive traffic so you can do more of it in the future.
These website metrics will help you answer that question.
3. Traffic By Channel
When it comes to marketing and analytics, a “channel” is any path visitors take to reach your website and other content. For example, some users may arrive at a site through your social media profiles (one channel), while others may get there via paid search (a second channel).
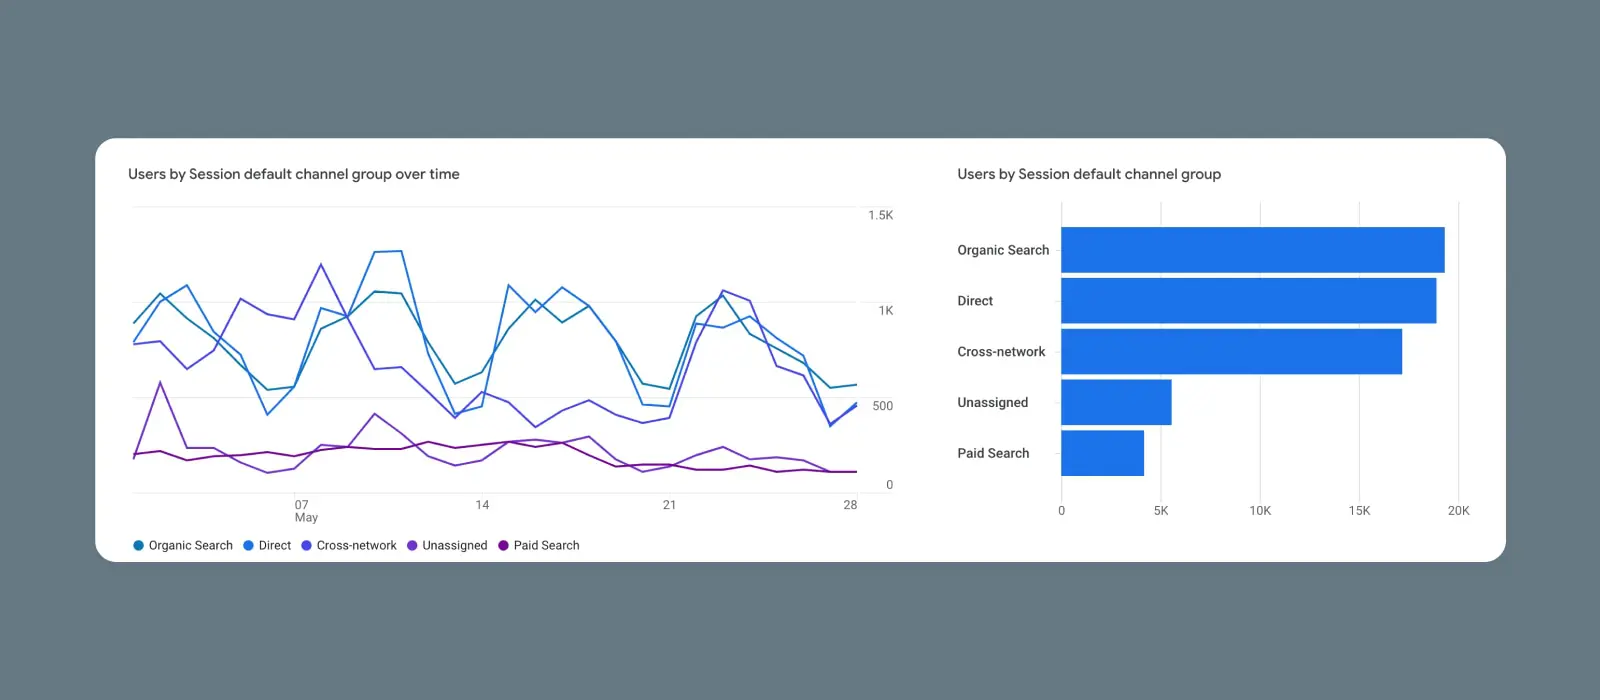
In Google Analytics, you can take your session data and filter it by channel.
Google provides a list of channel definitions as they pertain to tagging in its analytics system. This is so you can appropriately organize different funnels and keep tabs on which channels drive the most traffic.
You might want to look at all the traffic that comes to your site via social media links, for example. You can compare that result to traffic coming from email marketing campaigns. This can tell you which of your digital marketing strategies are most successful and which might need more work to improve their Return on Investment (ROI).
4. Organic Search Traffic
Organic search traffic includes visitors who arrive at your website from search engines like Google (or one of the growing set of AI-powered search tools) rather than through other channels such as social media, paid advertising, or referrals.
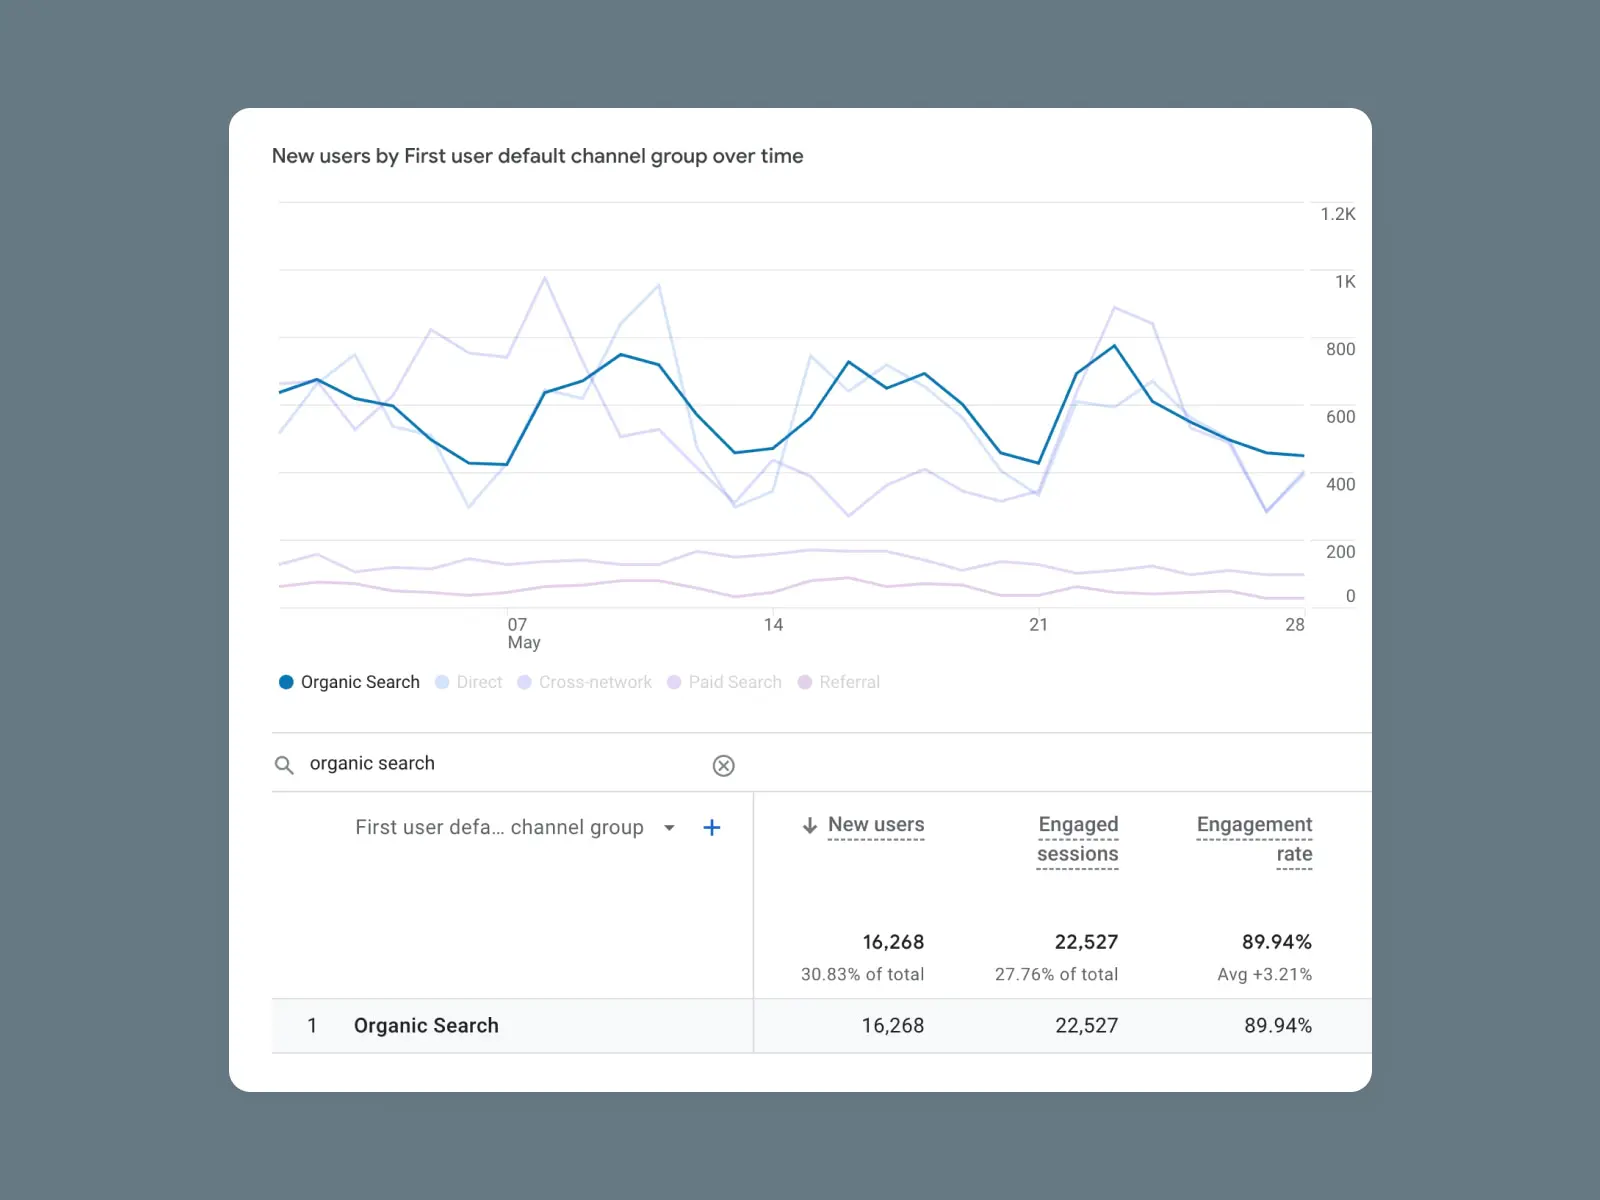
Organic search is significant because users who find your site this way are typically searching with a specific goal in mind. BrightEdge’s channel research (2019) put organic search at roughly half of all web traffic — and while that share is shifting as AI answers absorb clicks (when Google shows an AI summary, users click a result on just 8% of visits versus 15% without one, per Pew Research Center, 2025), organic remains most sites’ single biggest channel.
Increasing organic traffic means improving your website’s SEO to rank higher in search results.
New for 2026: watch your AI-assistant referrals too. In GA4, filter Traffic Acquisition by session source for referrers like chatgpt.com, perplexity.ai, and copilot.microsoft.com. These visits are still small for most sites, but they’re growing fast — and they tell you whether AI engines are citing your content.
5. Email Open Rates
If your business is anything like most businesses, you probably generate a lot of traffic through email marketing. Getting your email opened is the first step in driving a visitor to your website, and understanding your email open rate gives you a sense of the quality of your email list and your emails.
An email’s “open rate” represents how many recipients actually opened it in their inboxes. Mailchimp’s benchmarking data (2025) puts average open rates roughly between 30 and 40 percent, depending on your industry. One big caveat: Apple’s Mail Privacy Protection has auto-opened a chunk of email since 2021, inflating reported opens — so treat open rate as a directional trend and lean on click-through rate (below) as the truer engagement signal.
While there are many ways to encourage people to open your emails, your best option may be to try various strategies and keep an eye on the numbers to see which ones result in the most engagement. Just remember that tracking open rates does require email-specific tracking tools.
6. Email Click-Through Rates
Next up are your Click-Through Rates (CTRs). This represents how many people not only opened a given email but also clicked on one of the links it contained. This can include links back to your blog and social media platforms, as well as all kinds of direct CTAs.
This metric can have a big impact on your overall website performance since the higher CTR means that you’re generating more traffic to your site (and your customers are likely more engaged!)
The average benchmark for email CTRs is about 2.6 percent across all industries, per Mailchimp’s benchmark data (2025).
However, the specific metric you’re aiming for will depend on your audience, niche, and goals. A poor CTR on a given link may mean you need to spend some time developing stronger CTAs that appeal to your audience’s interests and needs.
7. Clicks From Social Platforms
Another important marketing metric to look at is your success with social media.
Traffic from X (formerly Twitter), Facebook, Pinterest, TikTok, Threads, Bluesky, and whatever other new platform has popped up this week is usually a good indicator that your content and your brand are resonating with your audience on those channels.
If you’re running a marketing campaign heavily on social media, you’ll likely want this metric to show plenty of clicks from your social content. Weak or static numbers can be addressed through smarter social media promotion strategies.
Engagement Metrics
Engagement can take many forms online.
In a general sense, it’s any way visitors interact with your site (besides simply reading its content). Engagement metrics are helpful for understanding if your content resonates with your audience, which content is most engaging, and the user experience on your website.
It’s also a leading indicator of how likely the traffic on your website is to make a purchase or complete a conversion.
8. Average Time On Page
The amount of time a visitor spends on the pages they visit (sometimes called “dwell time”) can be a complicated metric to track. With that being said, Google Analytics does provide a solid breakdown of the averages for each page on your site.
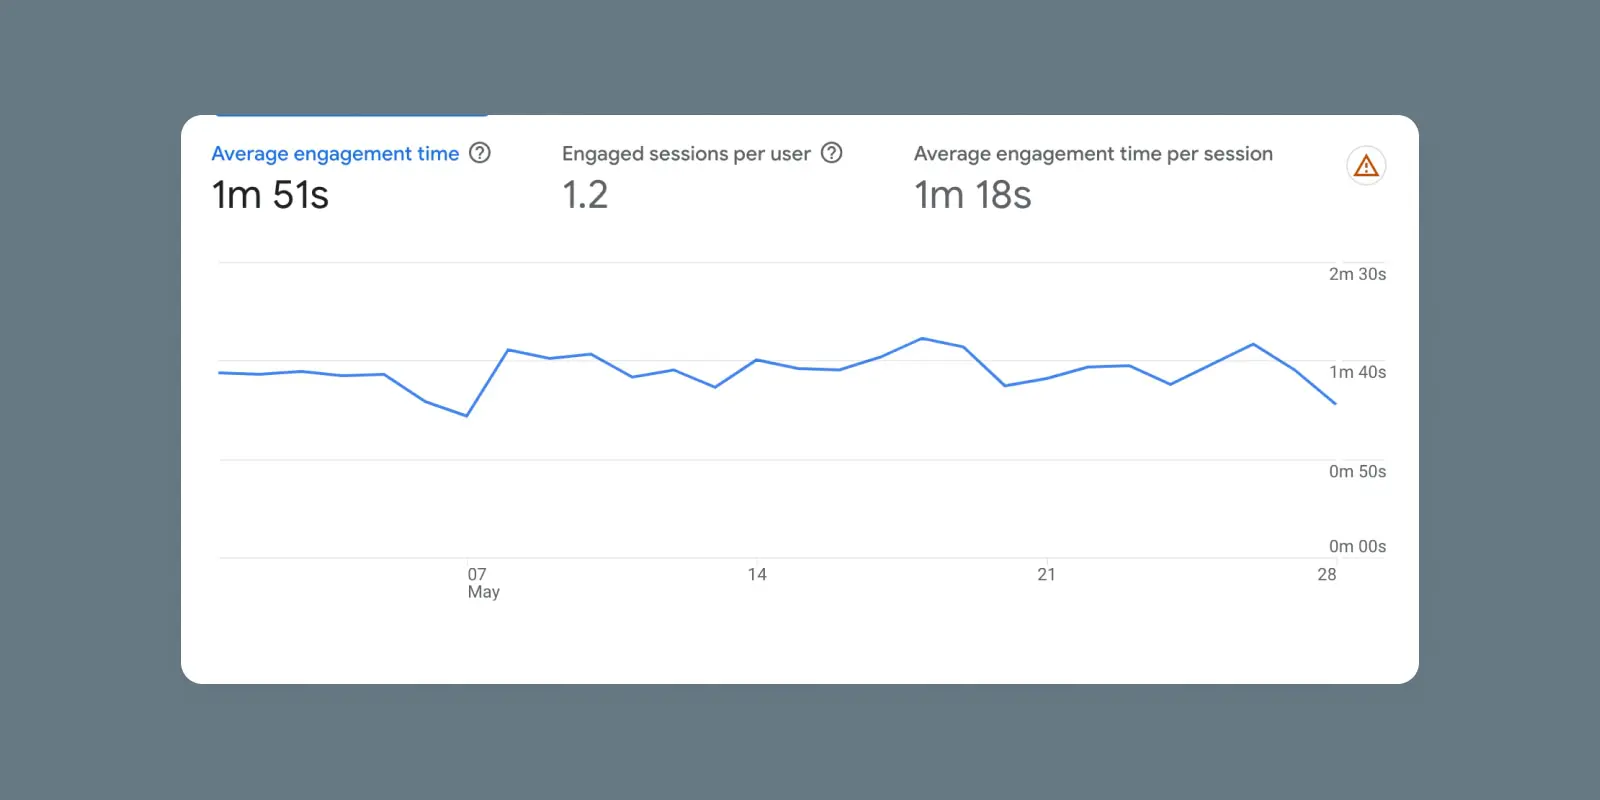
It’s calculated by averaging the amount of time that someone is on each page before clicking on another page on your website.
In GA4, the equivalent is called average engagement time — it measures how long someone actively engages with your site, and it captures visitors who click or scroll on your page but never move to another page. You’ll find it throughout GA4’s standard reports.
Dwell Time
‘Dwell time’ measures the time a user spends assessing a page they’ve discovered in the Search Engine Results Pages (SERPs). It begins the moment they click on a page and ends when they return to the SERPs or click out of the page.
Read MoreYou can also track the average session duration, which looks at the cumulative amount of time someone spends on your site.
Higher average time on page or average session duration likely means that users are more engaged with your site, but keep an eye out for any anomalies. For example, a high average session duration and a very low average time per page might indicate that users are confused and clicking back and forth.
9. Bounce Rate
Your site’s “bounce rate” is a measurement of how many viewers came to your site and then left without clicking to another page.
Bounce rate can be a much more effective measure of reader interest than traffic stats. While it’s great to see your website getting more visitors or sessions, it’s not great if most of that new traffic only visits one page before leaving.
A high bounce rate may indicate that your content isn’t resonating with your audience.
Alternatively, it could also be an indication that your traffic sources aren’t very good. If you’re blogging about fitness and your traffic is coming from sites about credit card debt, for example, you may have a high bounce rate and want to address this.
One caveat: GA4 changed what “bounce” means. A bounce is now any session of 10 seconds or less with no conversion or second page view — the inverse of GA4’s engagement rate — so old Universal Analytics benchmarks (like “25–40% is excellent”) no longer map cleanly. Track your own trend line instead: a rising bounce rate on a page that used to hold visitors is the signal that matters.
You can also look at the exact pages where visitors leave your website (the “Exit Rate” by page) to uncover any issues with specific content.
10. Pages Per Visit or Pages Per Session
When you measure “pages per visit” on your website, you’ll typically start with an average of the number of pages viewed over a given number of days divided by the number of unique visitors to your site during that same time frame. This gives you an idea of how users are interacting with your business.
Depending on how your website is set up, you might naturally have a low pages per visit metric. For instance, if your website mostly consists of specific landing pages with a single clear call to action, then readers may not navigate around before clicking a button or submitting a form.
On a flip side, a low pages per session metric could indicate that your content or your user experience needs work. If you have content with a lot of external links but not many internal links, you might be losing visitors who click to another site rather than staying on yours.
11. Returning Visitors
When you look at your “returning visitor” numbers versus your “new visitor” numbers, there are some assumptions you can make about your site’s overall traffic. You’ll be able to see whether your readership is growing, staying steady mainly due to loyal regulars, or declining.
In GA4, you can quickly see the ratio of new and returning visitors to your website by clicking Reports > Retention.
This is also sometimes represented as a percentage or a ratio. For instance, if your total number of visitors is 20 and 5 of them are returning visitors, then you’d have a 25 percent return visitor rate or a 0.25 ratio.
If you aren’t seeing a lot of return visitors, you may be attracting readers but struggling to really catch their attention.
Nerd note: You can see Google Analytics data directly from your WordPress admin panel by installing the MonsterInsights plugin. It’s one of the most popular WordPress plugins for Google Analytics. It enables you to display your data right in your dashboard, so you don’t have to go to another page to view it.
12. Social Shares Per Blog Post
If people love your content, they might share it. (Or they might not.)
One helpful way to see if your audience finds your content helpful is to track how many times your pages and posts get shared.
Public share counts are harder to come by than they used to be — most networks retired their share-count APIs — but you can still triangulate: BuzzSumo tracks content shares and mentions, each platform’s native analytics show your own posts’ reach, and UTM-tagged share links reveal which posts people actually pass along. Track the trend over time to see whether readers care enough to share.
Conversion Metrics
Conversions are often used to track sales on an ecommerce website, but a “conversion” can be any action you’d like to encourage on your site or blog.
For example, you might measure lead generation, sign-ups to an email list, or downloads of a free ebook. No matter what it represents, understanding your conversion rate helps you create a Conversion Rate Optimization (CRO) strategy to increase conversion rates.
13. Conversions
Step #1: Determine what a “conversion” means on your website.
Step# 2: Track how many times people take that action.
Whether a conversion is someone making a purchase, clicking a call-to-action (CTA) button, filling out a lead form, downloading a template, or just visiting your homepage, you want to know how often this happens on your website.
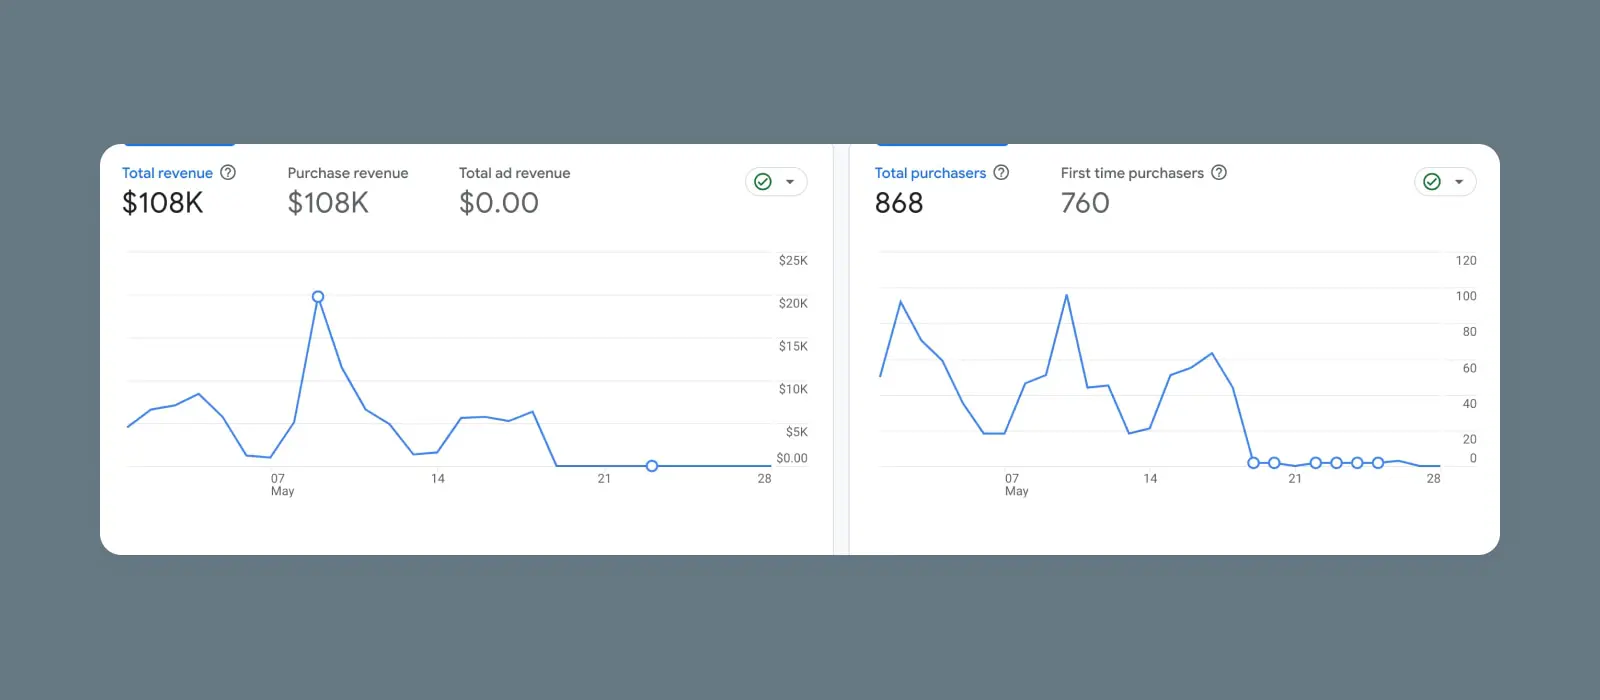
Note the total number of conversions and try to make that number go up each week.
14. Conversion Rate
Knowing how many people completed a conversion is helpful.
But knowing what percentage of people, on average, will complete that action can help you better plan, forecast, and budget for the future. For instance, if you know that 10% of your site visitors will convert, then you can make smarter decisions about investing in marketing and advertising to drive more traffic (and even more conversions!)
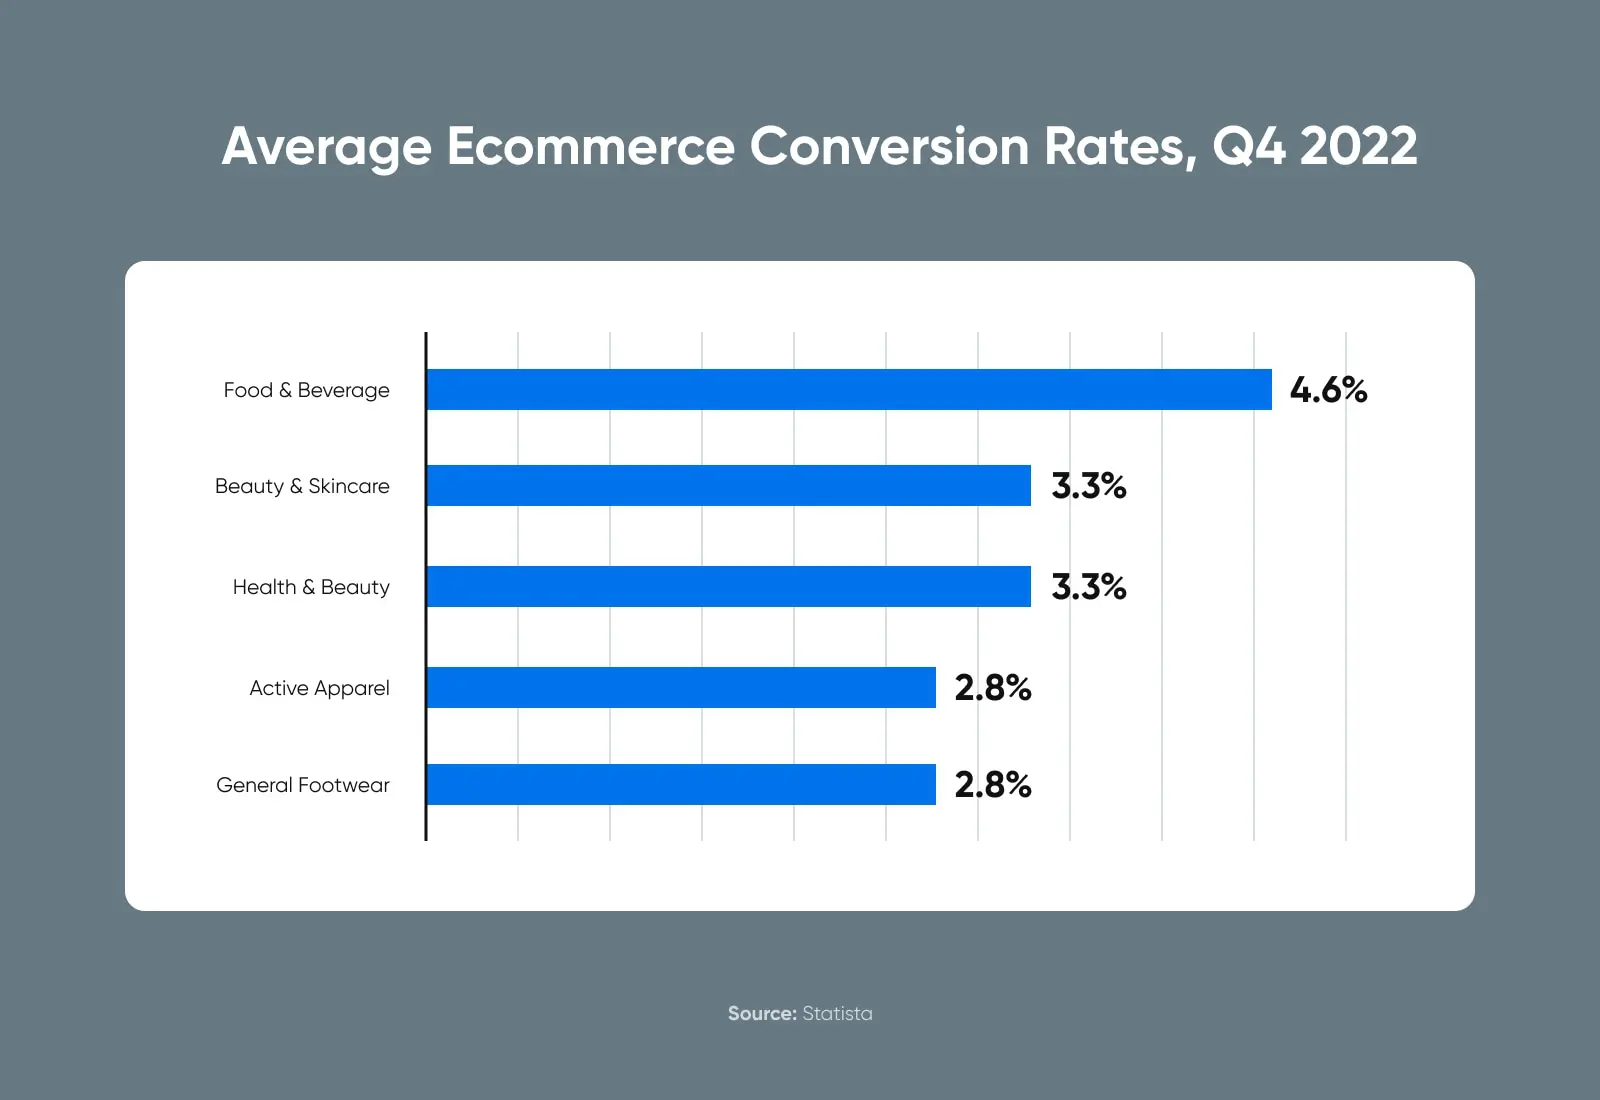
What constitutes a “good” conversion rate will depend on your business and what conversion you are tracking specifically. But, there are some great benchmarks on the web to help you understand if your overall conversion rate seems to be in a good place or could use some improvement.
15. Top Conversion Sources or Channels
Next, consider tracking your conversions by source or channel.
The goal is to find out which traffic sources (and marketing activities) are generating the most conversions. If your social media posts attract a lot of visitors, but almost none of those visitors convert, it’s time to consider whether you’re focusing on the wrong audience or failing to answer their particular pain points.
On the flip side, you may find that a channel like email drives most of your conversions and decide you can use email marketing more effectively to increase leads or sales.
SEO Metrics
Search Engine Optimization (SEO) is a collection of techniques used in web design and content creation to increase your website’s reach through search engines. SEO includes what’s called both on-page SEO and off-page SEO.
When done right, your search engine rankings should improve and you’ll increase your site’s traffic. That’s why it’s essential to know if your SEO strategy is making a difference.
These metrics aim to understand your website’s health and visibility on search engines.
16. Keyword Ranking
Keyword rankings indicate where your website appears in search engine results for specific words and phrases. For example, if you have a construction company, you want to show up near the top of the page for terms like “home builders near me” or “house construction companies in Los Angeles”.
The higher your site ranks for relevant keywords, the more visibility it will have to your audience. If you haven’t already, you’ll want to do some keyword research to determine which terms and phrases your target audience is searching for.
Then start tracking how you rank for those keywords.
There are several SEO tools you can use. Google Search Console will also show you details about how your website appears in search results.
If you’re looking for a more robust tool, we recommend checking out either Semrush or Ahrefs.
Both of these tools are used by SEO and marketing professionals in all kinds of industries. They offer day-to-day position tracking for your top keywords and a suite of other tools to help you level up your marketing and grow your site’s traffic.
17. Backlinks
Backlinks are links to your website from another site or vice versa. Many backlinks operate like citations, noting where the information came from and referring readers to the original source. Search engines tend to give preference to sites with lots of backlinks, especially if they’re coming from high-quality sources.
Backlink
A backlink is simply a link from one website (back) to another. If site owner A links to site owner B’s content, B has a backlink from A. Conversely, if site owner B links to site owner A’s content, A will have a backlink from B.
Read MoreBuilding backlinks can be tricky since you don’t have direct control over who links to your site. Whether you’re actively trying to generate backlinks or not, tracking the number of backlinks pointing to your website is one of the most important metrics for measuring SEO success.
Using a tool like Linkody, you can track and see links pointing to your website.
Or, again, you can use Google Search Console to track this metric.
18. Average Inbound Links Per Blog Post
While we’re talking about backlinks, consider measuring how many links each of your pages or blog posts attracts.
Looking at the average, you can get a sense of whether your SEO and content marketing efforts are contributing to your website’s overall domain ranking by generating links.
19. Top Exit Pages for Organic Traffic
Another common analytic you can track is the last page each user was on before leaving your website. This is called the “exit page.” Having this information at hand can be just as important as monitoring your overall organic traffic.
This is because the more you understand why users choose to leave your website, the easier it is to convince them to stick around longer. If the top exit pages share certain elements, such as a particular type or style of content, this can be a clue that your target audience is looking for something different.
Use Google Analytics to track your site’s top exit pages. In GA4 there’s no ready-made exit report: build one in Explore with the “Exits” metric (or add it to a pages report) to see where visitors drop off.
Website Speed Metrics
Finally, let’s talk about your website’s speed – how fast it loads when people try to visit.
One of the most important things to know about internet users is…they’re impatient as heck. They won’t wait an extra 2 seconds for your site to finish loading. Instead, if your site is slow, they’ll just hit “back” and find something else to look at.
So, yeah, your website’s speed is important.
Luckily, there’s one big metric you can track to understand your site’s loading and performance.
20. Page Speed (Core Web Vitals Score)
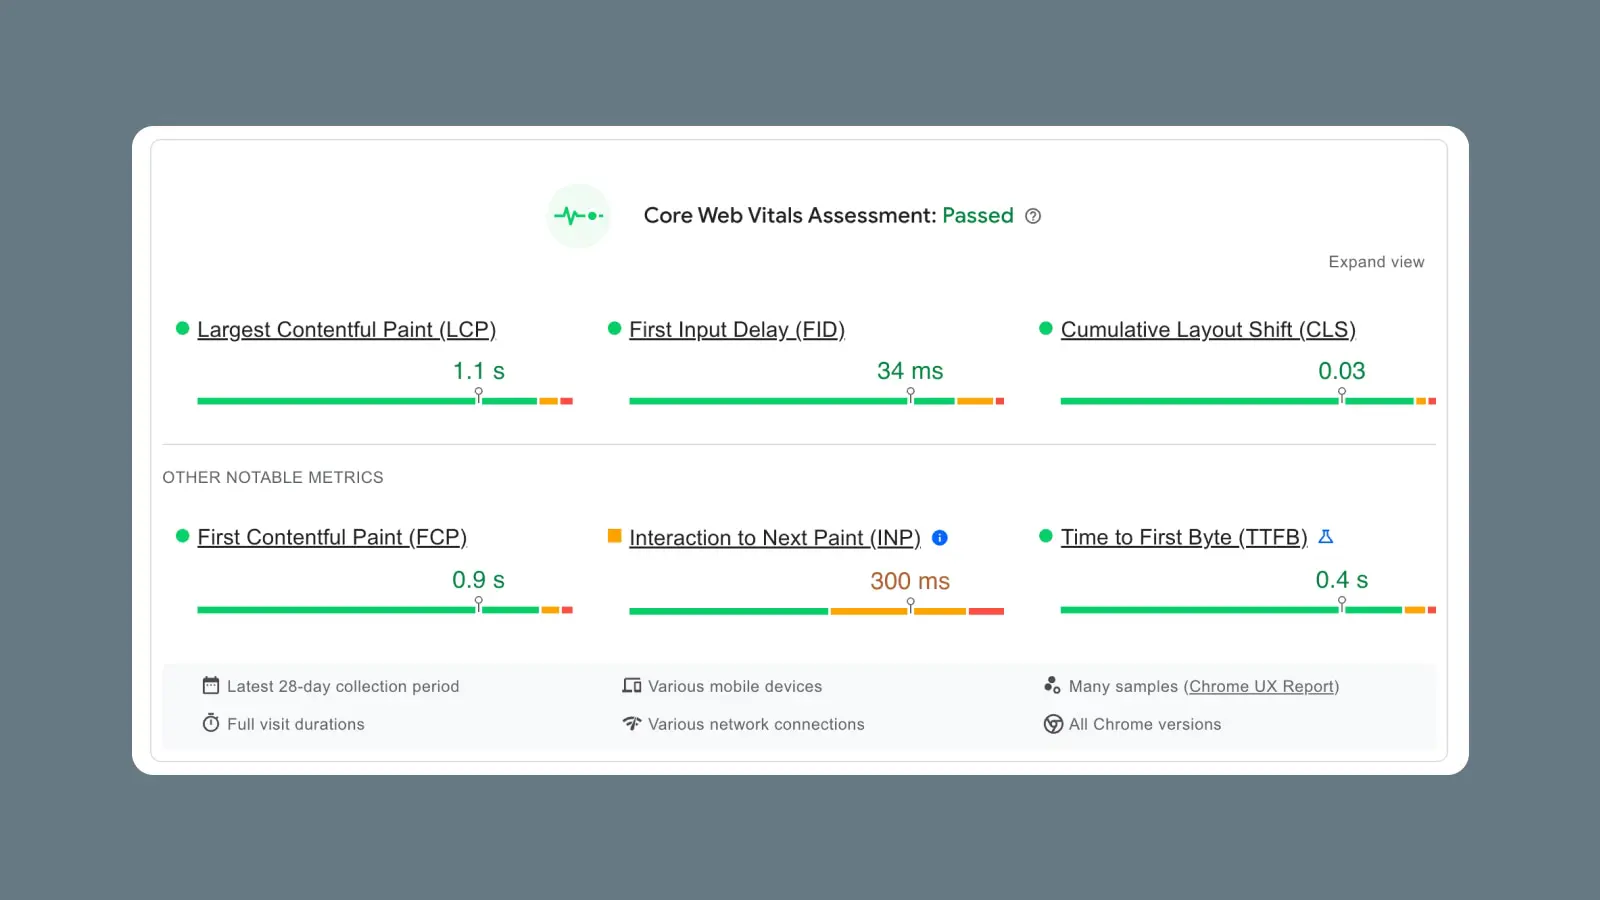
Google’s Core Web Vitals is actually an array of metrics about your website’s performance and load speed. The current trio: Largest Contentful Paint (loading), Interaction to Next Paint (responsiveness — it replaced First Input Delay in March 2024), and Cumulative Layout Shift (visual stability).
The key takeaway: Pass Core Web Vitals, and you’re doing pretty dang good.
All you have to do is run the Google PageSpeed Insights analysis to get the metrics you need about load times, page responsiveness, and more.
Fortunately, if your scores aren’t great, you can easily optimize your website for speed.
Website Metrics FAQs
What are the most important website metrics to track?
Start with five: sessions (traffic volume), engagement rate, conversion rate, organic search traffic, and Core Web Vitals. Together they tell you whether people are finding your site, staying on it, and doing what you built it for.
How often should I check my website metrics?
Weekly for a quick pulse, monthly for real decisions. Day-to-day numbers are noisy; month-over-month and year-over-year comparisons reveal actual trends without tempting you to overreact to a slow Tuesday.
What’s a good bounce rate in GA4?
There isn’t one. GA4 redefined bounces (sessions of 10 seconds or less with no engagement), which made every old benchmark chart obsolete. The useful question is whether a specific page’s bounce rate is rising or falling over time — not how it compares to another industry’s average.
Can I track traffic from AI assistants like ChatGPT?
Yes — GA4 records them as referrals (see metric #4 for the setup). Keep in mind referral clicks understate your real AI presence: assistants often answer using your content without sending a click, so spot-check the engines directly by asking them your customers’ questions.
Managing Your Site’s Metrics So You Can Build Your Business
We’ve just stepped through the most important metrics for your website, and it might feel like a lot of things to track.
It takes a lot of data to understand your site’s performance because it is complicated. Every site is unique, and every person who visits your site has a slightly different experience. The goal is to understand that experience the best we can and then make it the best it can be for every single one of your website visitors.
If you’re feeling a bit overwhelmed by all of these metrics (or the numbers aren’t looking so hot), then consider bringing in some professional help. In addition to helping you build websites, the DreamHost Marketing Services team can also help you build your business and track the right data to prove it.

Get More Visitors, Grow Your Business
Our marketing experts will help you earn more traffic and convert more website visitors so you can focus on running your business.
Learn More