Feel the need? The need for speed? If you want your site to outpace the competition, try GTmetrix.
This popular tool helps you measure your site’s current performance, identify areas for improvement, and determine which changes to make.
Use it correctly, and you can expect much faster load times. That means happier visitors, better search rankings, and improved visibility in AI chats.
Not sure where to start? That’s what this guide is all about. You’re going to learn:
- What GTmetrix can do.
- How to use the tool to tune up your website.
- How using GTmetrix can improve your SEO and GEO.
- More tips on improving your site speed.
Let’s get this show on the road!
What Is GTmetrix?
GTmetrix is a popular online website speed test tool that analyzes your site’s performance and provides helpful insights on where to make improvements.
When you analyze your site with GTmetrix, the platform scores your site based on important metrics from Google Lighthouse and Core Web Vitals.
The report allows you to pinpoint bottlenecks in your site’s loading process and prioritize fixes that will lead to faster load times and a better overall user experience.
Why Use GTmetrix?
GTmetrix is one of the most popular tools for understanding and improving your website’s speed and performance.
There are several reasons why you should consider using it.
- It offers a free tier: While it comes with limitations, you don’t need to pay a dime to access the basic features in GTmetrix.
- It’s easy to use: Compared with many performance testing tools, GTmetrix is very user-friendly. That means you can quickly see what is working on your site and where you need to make changes.
- It offers really useful data: GTmetrix runs tests in a real web browser, so the information it provides is a true reflection of your website.
- It guides you through optimization: GTmetrix isn’t just a testing tool. It shows you exactly how to improve your site’s performance.
Sounds perfect! But don’t get carried away just yet…
What Are the Limitations of GTmetrix Free Accounts?
GTmetrix used to be a free tool with premium upgrades. But recently, stricter limits have been imposed on free accounts:
- Tests are limited to five per month.
- You don’t get access to mobile device testing.
- You can monitor only one URL per day; premium users can get hourly results across multiple sites.
- You only get seven test server locations.
- Test data is only saved for one week.
- And the big one: you only get free on-demand testing for 6 months.
To unlock the full version of GTmetrix, you need a premium subscription. Plans start at $51 per year, so they’re not crazy expensive.
But if you’re just starting with site optimization, you might prefer to stick with a free account…or use an alternative tool.
The Best Free GTmetrix Alternative: WebPageTest.org
While GTmetrix is the most popular name in site performance testing, there are good, totally free alternatives. Our pick is WebPageTest.org.
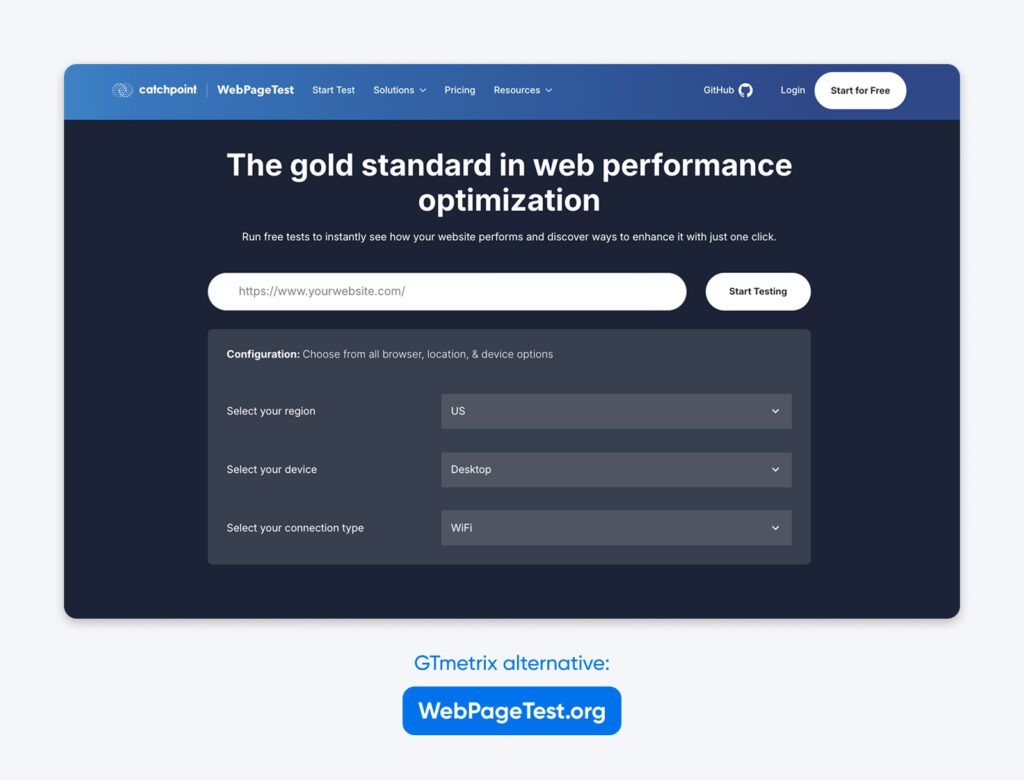
On the free plan, this tool offers:
- 150 tests per month
- Complete mobile device testing
- Longer data retention
- And there’s no time limit on the free tier
Clearly, WebPageTest.org is a worthy competitor, but it’s definitely aimed more at developers, with lots of diagnostic details and fewer helpful aids. That can make it a little intimidating for your average site owner.
We recommend trying both tools and seeing which works better for you.
How Do You Use GTmetrix?
Using GTmetrix to analyze your site’s performance is actually very straightforward. Here’s a step-by-step guide to help you get started:
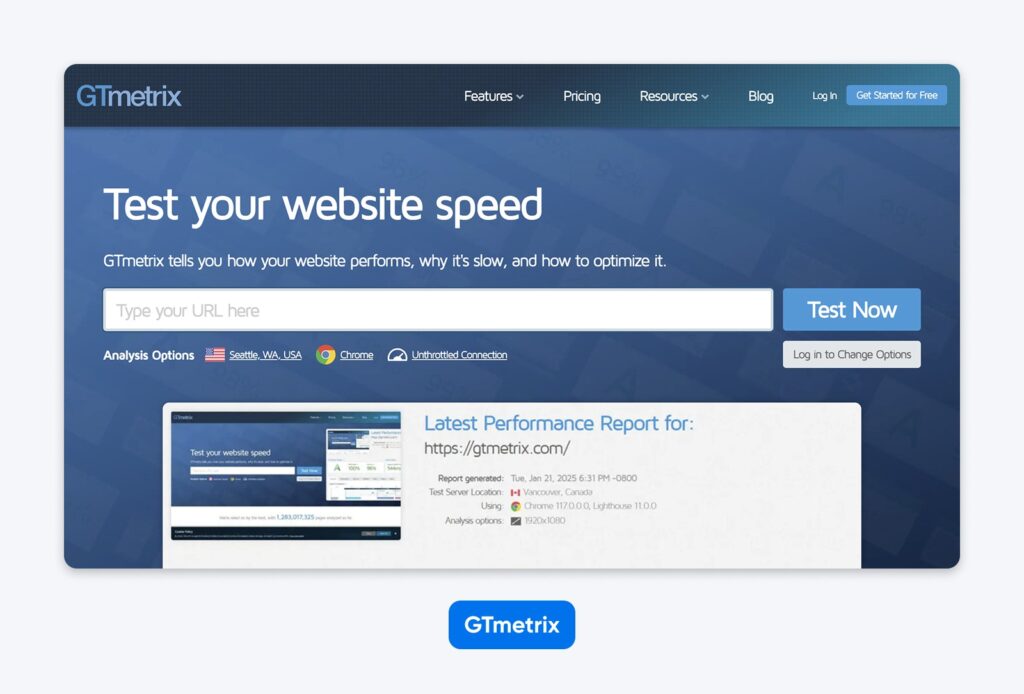
Step 1: Visit the GTmetrix Website
Visit https://gtmetrix.com.
The entire tool is web-based, so you won’t need to download anything to use it.
The free version covers the basics; you’ll need to create an account for some features. To unlock everything, you’ll have to upgrade to a paid GTmetrix subscription.
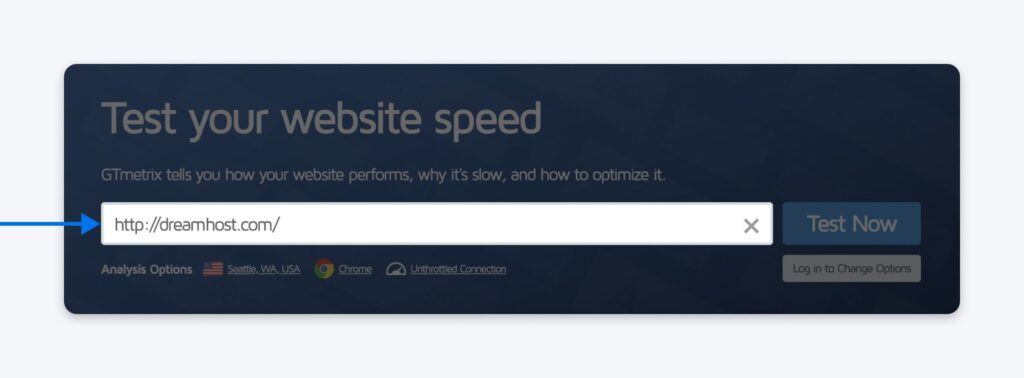
Step 2: Enter Your Website URL
Type the URL of your website into the big box on the homepage.
Step 3: Choose Your Test Location and Browser (Optional)
GTmetrix offers different analysis options for premium users, like the ability to choose from different test locations and browsers.
This option can reveal how your website performs for users around the world, with different devices and connection speeds.
If you have a GTmetrix Pro account, you can choose from test servers in 22 locations. You can also test with specific browsers, including Google Chrome, Firefox, and mobile browsers, or use different connections, from 56k dial-up to an unthrottled connection.
If you haven’t signed up or if you’re using a free account, you won’t have these options. So, you can skip this step and go straight to analyzing your site.
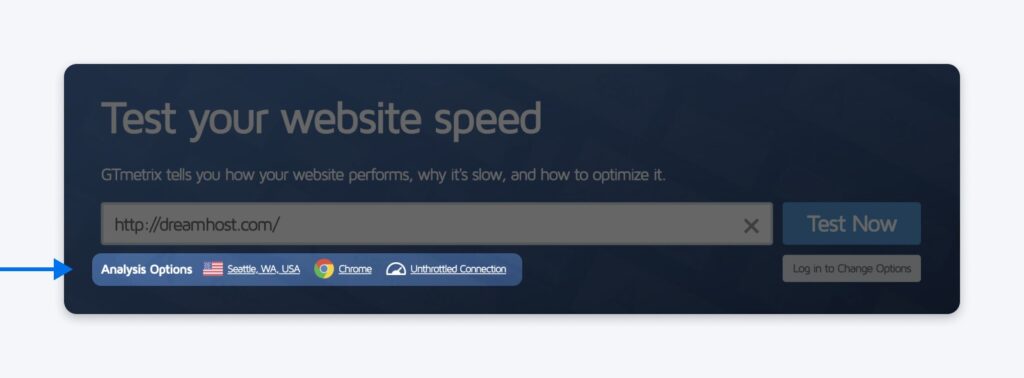
Step 4: Start the Test
Click the Test Now button. GTmetrix will then start analyzing your site.
Once the analysis is complete, you’ll get your detailed report. Ready to dive in and start deciphering the results?
We’ll do that next.
How To Read and Analyze Your GTmetrix Report?
GTmetrix provides a wealth of information about your website. To make it easier to digest, the tool first gives a quick overview of your test results.
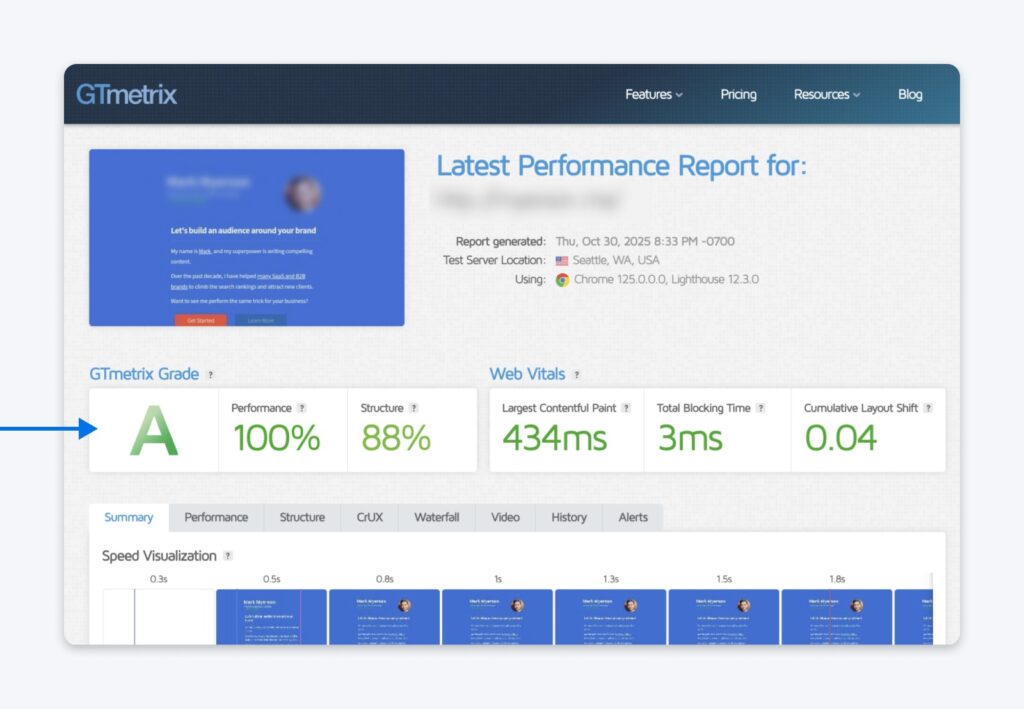
On the left is your GTmetrix Grade panel, which has three parts:
- GTmetrix Grade: The closer it is to an A, the better. Aim for B or higher.
- Performance score: Measures how well your site performs from the user’s perspective. The higher the better.
- Structure score: How well your site is constructed for optimal performance. Higher is better.
On the right, you’ll find the Web Vitals panel. This shows the most important metrics:
- LCP (Largest Contentful Paint): The time it takes for the largest image or text block to display in the visible part of the web browser. This has a significant impact on perceived load times. We want 1.2 seconds or less.
- TBT (Total Blocking Time): The amount of time that scripts block your web page’s loading process. Around 150 milliseconds is the benchmark here.
- CLS (Cumulative Layout Shift): The amount of unexpected layout movements that happen while your web page is loading. Aim for 0.1 and below.
You can think of these metrics as the headlines — the big stuff that you have to get right. But there’s plenty more to see.
You’ll notice on the results page that there are some tabs: Summary, Performance, Structure, CrUX, Waterfall, Video, and History. Each holds additional information about your site.
The Summary Tab
The “Summary” tab provides a snapshot of the high-level information GTmetrix learns about your site.
At the top of the page is a speed visualization, which shows a timeline of key events during your page’s load time — stuff like First Contentful Paint, Time to Interactive, and Fully Loaded Time.
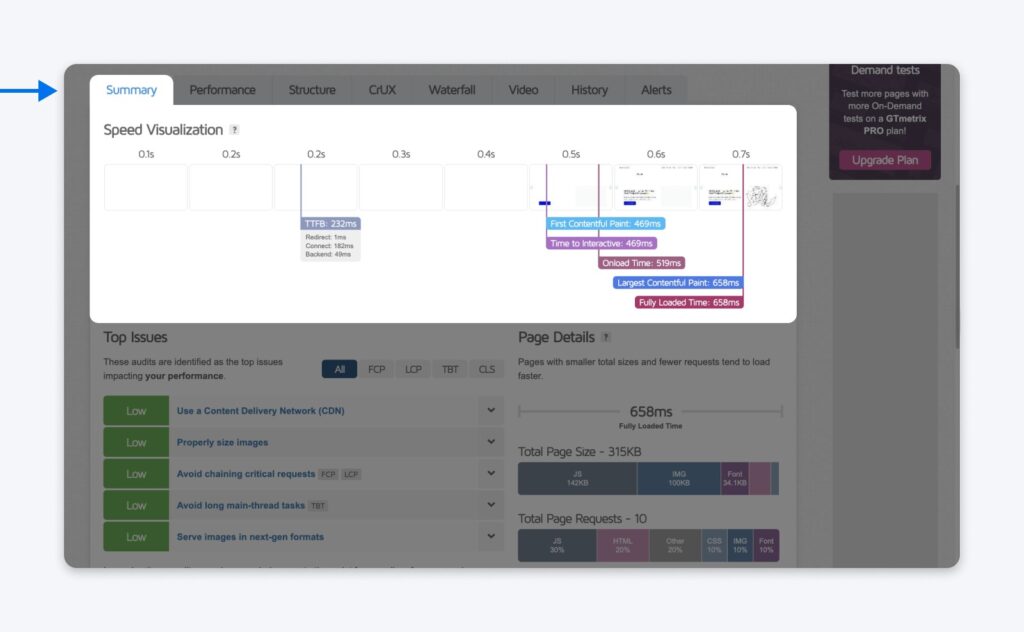
Below that, you’ll see a list of the top issues GTmetrix has identified that are impacting your site’s performance.
At the bottom of the Summary tab is the “Page Details” section. This shows the file sizes of all page elements, along with a percentage breakdown.
You don’t need to spend a lot of time in this tab; it’s mostly there for informational purposes.
The Performance Tab
The Performance tab is where you can really dig into your site’s load time metrics.
Remember the timeline we saw before? The Performance Metrics section makes that data easier to scan.
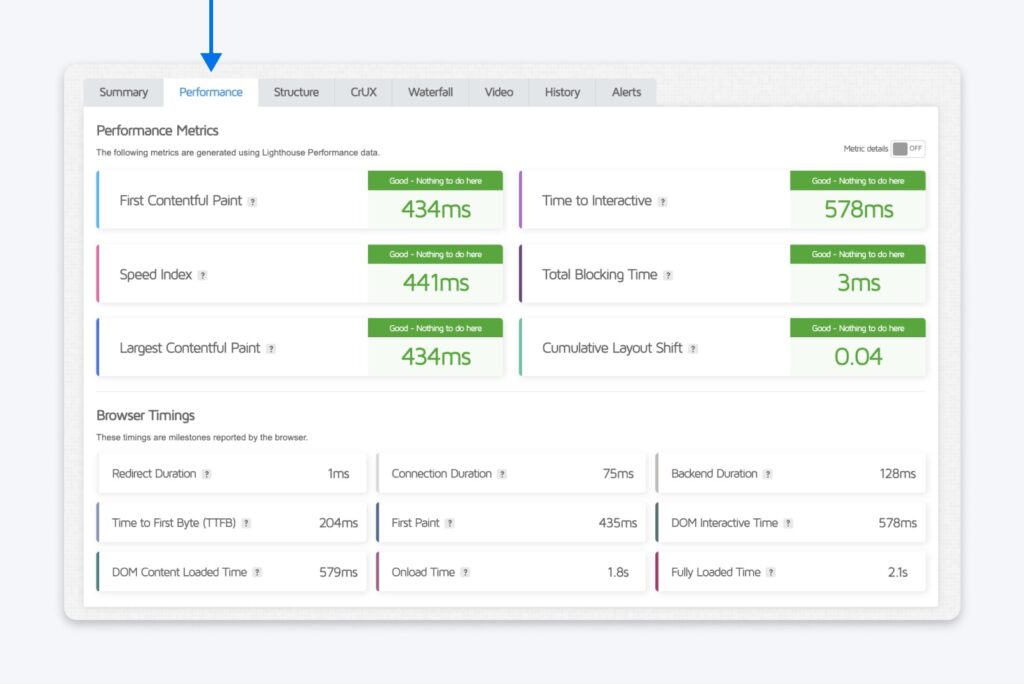
In addition to metrics we’ve seen before, you can find timings for:
- First Contentful Paint: How quickly the first content elements appear on your page. For some sites, this is text. For others, it’s images. Anything under 2.5 seconds is okay.
- Time to Interactive: How long before your site becomes fully interactive — i.e., how long after the page starts loading until users can do things like click links and buttons.
- Speed Index: How fast the content on the page becomes visible to the user.
Keep scrolling down, and you’ll see the “Browser Timings” section. This gives us a whole heap of other metrics to explore.
- Redirect Duration: The time taken for all redirections (HTTP to HTTPS, domain redirects, etc.) to complete.
- Connection Duration: How long it takes to establish a connection between the user’s browser and the server, including the time taken for the TLS/SSL handshake if the site is using HTTPS.
- Backend Duration: How long it takes for the server to generate the page.
- Time to First Byte (TTFB): Time from the user making an HTTP request to receiving the first byte of data from the server.
- First Paint: Time before the first visual element appears on screen.
- DOM Interactive Time: Time for the HTML Document Object Model (DOM) of the page to be fully constructed and interactive.
- DOM Content Loaded Time: How long it takes for the DOM to be interactive and for all the scripts to be loaded.
- Onload Time: How long for the page and all its assets, including images, CSS, and JavaScript, to be fully loaded and the onload event to be triggered.
- Fully Loaded Time: The total time for not only the page to be fully loaded, but also for all additional network activity to stop.
Much like the Summary tab, this is a great place to find more information about your site. But the most actionable data is still to come!
The Structure Tab
The Structure tab is where the magic happens. This is where GTmetrix delivers a comprehensive audit of your site, based on Google-established best practices.
Or in simple terms, this is your to-do list.
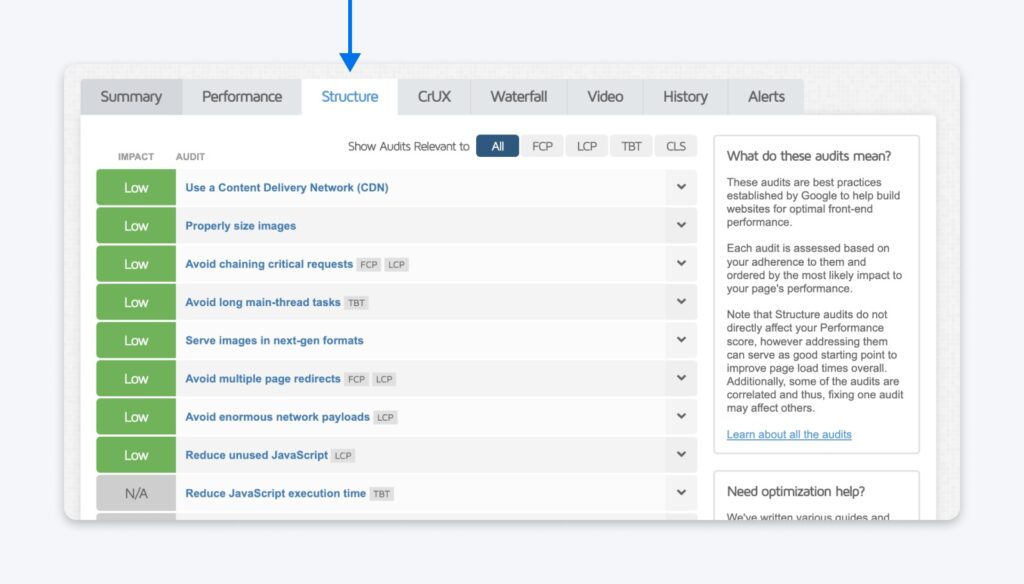
In this tab, you’ll see all the top issues GTmetrix has identified for your site. They are ordered by priority, so the changes that will have the greatest impact on your site’s speed and performance come first.
GTmetrix also tells you exactly how to solve each issue. Just click on any item in this list, and it will expand to reveal a more detailed explanation.
For the full tutorial, tap Learn how to improve this in the top right.
Depending on how many issues your site has, this is where you’ll want to spend the bulk of your time using GTmetrix. Once you’ve solved as many issues as possible, you can explore the rest of the tabs in your analysis.
The CrUX Tab
Want a deeper look at how visitors experience your site? You’ll want to check out the CrUX (Chrome User Experience Report) tab. This area of the analysis delivers data from real users of the Google Chrome browser.
That means you get an accurate reading of how your website works in the real world, not just under GTmetrix test conditions.
Unfortunately, the CrUX tab isn’t always as helpful as you might expect — simply because Google doesn’t have enough data to draw meaningful conclusions. But it’s worth it to check the tab anyway. If you see data, compare it with the numbers on your Performance tab. Any major differences could mean something needs fixing.
The Waterfall Tab
Why is it called the Waterfall tab? Because it features a waterfall chart: a graph that shows how your website loads in detail.
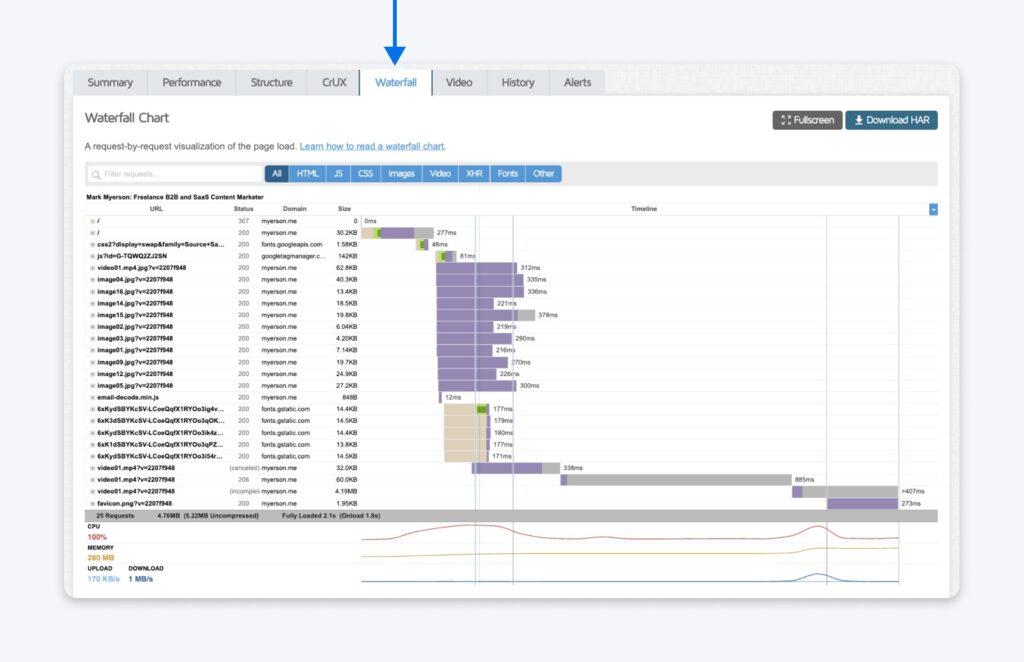
That means scripts, media files, requested third-party resources, and their request details, durations, and execution times. The bar lengths indicate how long each element took to request, download, and execute.
The Waterfall tab might look overwhelming at first, but the section-by-section breakdown can help you spot bottlenecks or problematic areas of your site.
The Video Tab
On the Video tab, you can watch a video of your page loading. You can even slow down the video playback to better visualize loading behavior and jump to major milestones during your page load.
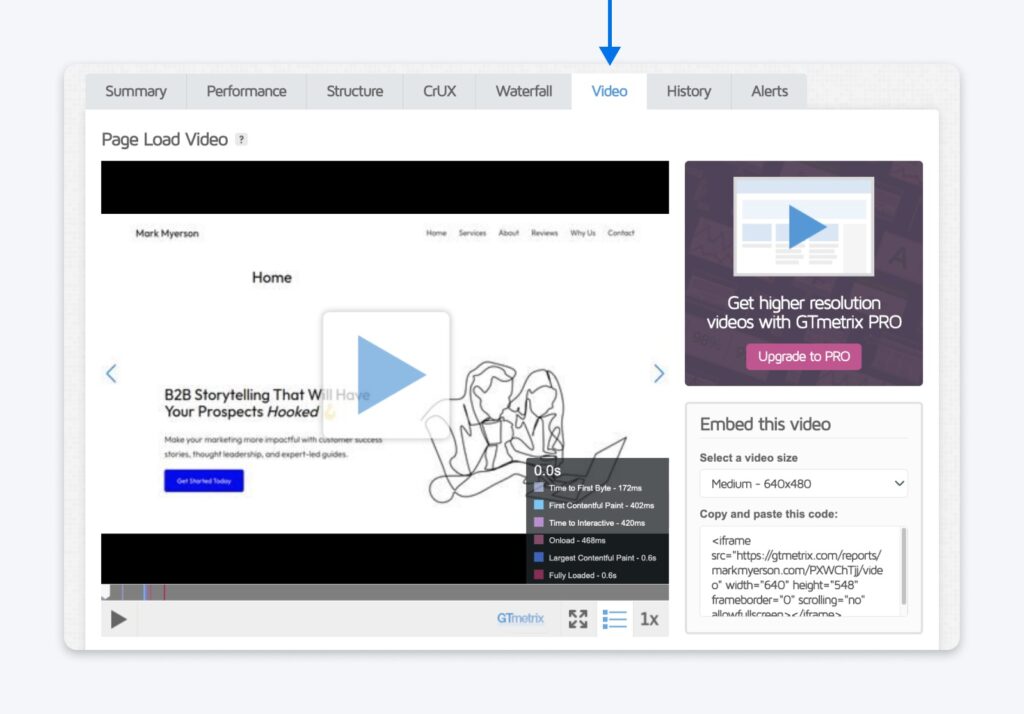
Be aware, this feature is only available if you create a GTmetrix account (free). And it’s not automatically included in the first analysis; you’ll need to visit the Video tab and hit Enable Video and Re-test to check out the footage.
The History Tab
Finally, there’s the History tab. Here, you can view your past reports (if you have an account and are signed in).
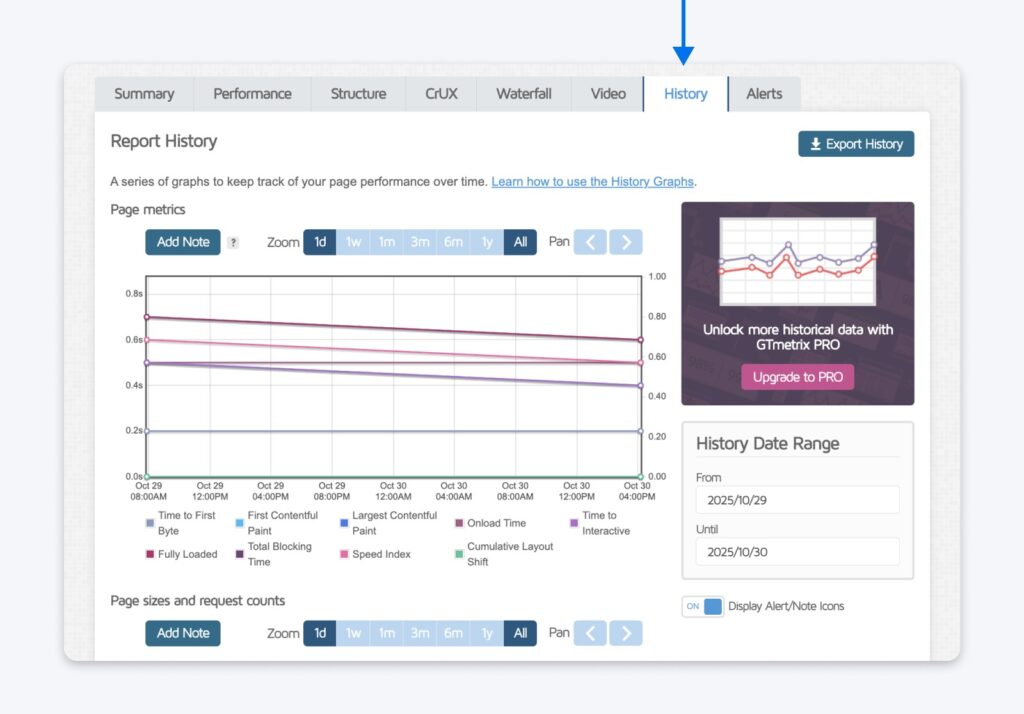
You can also use “History Graphs” to compare your site’s functionality with past analyses and track its performance over time.
How To Speed Up Your WordPress Site
The whole point of using GTmetrix is to get actionable recommendations for optimizing your site that are tailored to what’s actually slowing it down – so definitely start there. Of course, there are still some great best practices everyone can use to make sure their site moves at lightning speed. Try these recommendations if your WordPress site could use a boost:
- Choose a good host. Your web hosting provider is vital to your site’s performance. Opt for a reputable hosting provider that offers resources tailored to your site’s needs, like DreamPress managed WordPress hosting.
- Use a Content Delivery Network (CDN). CDNs can distribute your website’s static content across servers located worldwide, allowing visitors to load the site from a server closer to their location.
- Optimize images. Large image files can slow down your site. Use tools or plugins like Smush, ShortPixel, or EWWW Image Optimizer to compress and resize images without compromising on quality.
- Minify and combine files. Minify your CSS, JavaScript, and HTML files to reduce their size. Plugins like WP Rocket, Autoptimize, or W3 Total Cache can help with this.
- Use caching. Implement caching to store copies of frequently accessed data, reducing the need to regenerate that data. Popular plugins for this include WP Super Cache, W3 Total Cache, and WP Rocket.
- Limit your plugins. Every plugin adds some overhead to your site. Only install necessary plugins, and periodically review and deactivate or delete any that are no longer needed.
- Optimize your database. Regularly clean your WordPress database to get rid of unnecessary data, like post revisions, trashed items, and transient options.
- Reduce redirects. Having many redirects increases page load time, especially for mobile users. Ensure that you limit the number of redirects on your site.
- Use the latest PHP version. WordPress runs on PHP. Ensure your server uses a recent version of PHP for improved performance and security.
- Keep WordPress updated! Regularly update the WordPress core, themes, and plugins to ensure you have the latest speed optimization improvements and security patches.
How To Use GTmetrix for SEO and AI Visibility (GEO)?
Search engines like Google want to provide users with the best possible experience. A slow, clunky website is a huge turn-off.
This is where site speed becomes a critical factor in search engine optimization (SEO). As we mentioned earlier, a faster website leads to better engagement, lower bounce rates, and ultimately, higher rankings.
Think of GTmetrix as your site performance coach. It provides clear instructions for creating the type of user experience search engines adore.
Site speed and user experience are also essential for the next wave of search: generative engine optimization (GEO).
AI-powered search engines like ChatGPT and Google’s SGE aim to provide direct answers. They pull information from sources they deem high-quality, authoritative, and fast.
A good user experience is a universal signal of quality, making your site more attractive to both traditional search algorithms and new AI models.
And making your site load faster helps AI platforms assess your content more efficiently. They love that.
So, how do you translate your GTmetrix report into tangible SEO and GEO benefits? Start by focusing on these key areas.
- Aim for an “A” Grade: Your top-level GTmetrix Grade is a quick summary of your overall performance. Getting an “A” grade and a Performance score above 90% is a clear signal to search engines that your site is well optimized.
- Focus on your Core Web Vitals: Pay close attention to the LCP, TBT, and CLS scores. GTmetrix will flag any of these that are “Poor” or “Needs Improvement.” Fixing these is your top priority for better search rankings.
- Work through the Structure tab: This is your SEO goldmine. The Structure tab provides a checklist of Google-approved ways to improve site performance, from optimizing images to browser caching.
- Keep an eye on your Waterfall chart: Use this feature to identify slow-loading elements (like large images or clunky scripts) that are dragging down your user experience and, consequently, your search potential.
How To Speed Up Your WordPress Site?
The whole point of tools like GTmetrix is to get recommendations for improving your site’s performance based on live data. So, definitely start there.
But aside from that, there are best practices you can follow to keep your site moving at lightning speed:
- Choose a good host: Your web hosting provider is vital to your site’s performance. Opt for a reputable hosting provider that offers resources that match your needs. (Hint: DreamHost has been providing reliable hosting for over 25 years.)
- Use a Content Delivery Network (CDN): CDNs can distribute your website’s static content across servers located worldwide, allowing visitors to load the site from a server closer to their location.
- Optimize images: Large image files can slow down your site. Use tools or plugins like Smush or EWWW Image Optimizer to compress and resize images without compromising on quality. You can also enable lazy loading and choose modern formats like WebP and AVIF.
- Minify and combine files: Minify your CSS, JavaScript, and HTML files to reduce their size. Plugins like WP Rocket, Autoptimize, or W3 Total Cache can help with this, and many frameworks can do the same job.
- Use caching: Implement caching to store copies of frequently accessed data, reducing the need to regenerate that data. Popular plugins for this include WP Super Cache, W3 Total Cache, and WP Rocket.
- Optimize your database: Regularly clean your WordPress database to get rid of unnecessary data, like post revisions, trashed items, and transient options.
- Reduce redirects: Redirects increase page load time, especially for mobile users. Try to limit the number of redirects on your site.
- Use the latest PHP version: WordPress runs on PHP. Make sure your server is running a recent version of PHP for good performance and security.
And most importantly — keep WordPress updated! Keep WordPress core, your themes, and your plugins updated so you have the latest speed optimization upgrades and security patches.
GTmetrix Frequently Asked Questions (FAQs)
Still curious about GTmetrix or site performance? We have all the answers right here.
Is GTmetrix free?
GTmetrix offers a free version that allows users to test and analyze their websites.
But for more advanced features, such as multiple test locations and more frequent monitoring, you’ll need to pay for a PRO subscription.
Is GTmetrix a reliable tool?
Yes, GTmetrix is a very reliable tool because it uses Google’s own Lighthouse data to analyze your site’s performance.
It provides a very accurate snapshot of your technical performance and user experience.
Why do I get different results when I test my site multiple times?
Minor variations in test results are normal due to factors like server traffic, network conditions, and third-party ads.
To get the most accurate picture, run your test three times and focus on the median result rather than a single score.
How does GTmetrix compare with a tool like WebPageTest.org?
GTmetrix is great for quick, easy-to-understand reports. If you’re just a regular site owner looking to make improvements, you’ll feel at home.
In contrast, WebPageTest.org offers more advanced, in-depth diagnostics from more locations for free. That makes it a favorite with developers, who might be troubleshooting complex issues.
What is a good GTmetrix Grade?
Aim for a GTmetrix Grade of “A” and a Performance score of 90% or higher. And make sure all the Core Web Vitals metrics are in the “Good” (green) range.
A high grade shows you’re delivering a user-friendly experience that search engines favor.
What should I do if I get a bad GTmetrix Grade?
Don’t panic! Dive into your report’s Structure and Waterfall tabs. Here, you’ll find a prioritized checklist of precisely what to fix — such as optimizing large images or addressing slow-loading scripts.
How fast should my site actually load?
Aim for your Largest Contentful Paint (LCP) to be under 2.5 seconds, which Google considers a “Good” user experience.
Anything over 4 seconds is considered “Poor” and significantly increases the chance that a visitor will leave your site before it even loads.tice to benchmark against competitors and continuously work on improving load times to provide the best user experience.
Get More Visitors, Grow Your Business
The best-designed site is worthless if no one can find it. Leverage proven online marketing strategies and techniques to help more of your target audience find you.
See More