
Small business owners often get to experience a special kind of whiplash: You have your biggest revenue month ever, open your bank account, and think, “Wait. Where did it go?”
The clients are there. The invoices are there. The calendar is packed. Your team is busy. But after payroll, contractors, software, taxes, project overruns, admin time, and some unexpected revisions, the profit is gone.
That’s an unfortunate truth of agency life: Busy and profitable are not the same thing. In fact, a growing agency can become less profitable as revenue rises if pricing, scope, utilization, and overhead are not managed carefully enough.
Freelancer math is a lot simpler: Money comes in, expenses go out, and the difference is yours. Agency finances are a different animal when you have to manage payroll, overhead, project profitability, utilization rates, and cash flow timing — and if you don’t understand the math, you can be busy and broke at the same time.
How to manage agency finances
Agency finances have a lot more moving parts than freelancers contend with: labor, utilization, overhead, payment timing, retainers, contractors, software, taxes, founder compensation, and profit.
The basic financial model is simple:
Revenue – Cost of Delivery (team salaries, contractor costs) = Gross Profit
Gross Profit – Overhead (rent, tools, insurance, admin) = Net Profit
But the hard part is making sure you are including all the real costs:
| Category | What It Includes |
| Revenue | All fees paid by clients |
| Direct labor | Employee salaries and wages, plus contractor fees |
| Overhead | Software Hosting Admin costs Bookkeeping Legal fees Insurance |
| Sales and marketing | Content Ads Networking Proposal time |
| Founder compensation | Your salary and/or owner draw |
| Profit | Everything that’s left |
One line in that table deserves special attention: founder compensation. Pay yourself a market-rate salary for the role you actually do, and treat it as a real cost line before you calculate profit. If the numbers only work when you work for free, the business isn’t profitable; you’re just subsidizing it. Profit is what’s left after everyone gets paid, including you; any extra owner distributions come out of that profit, not before it.
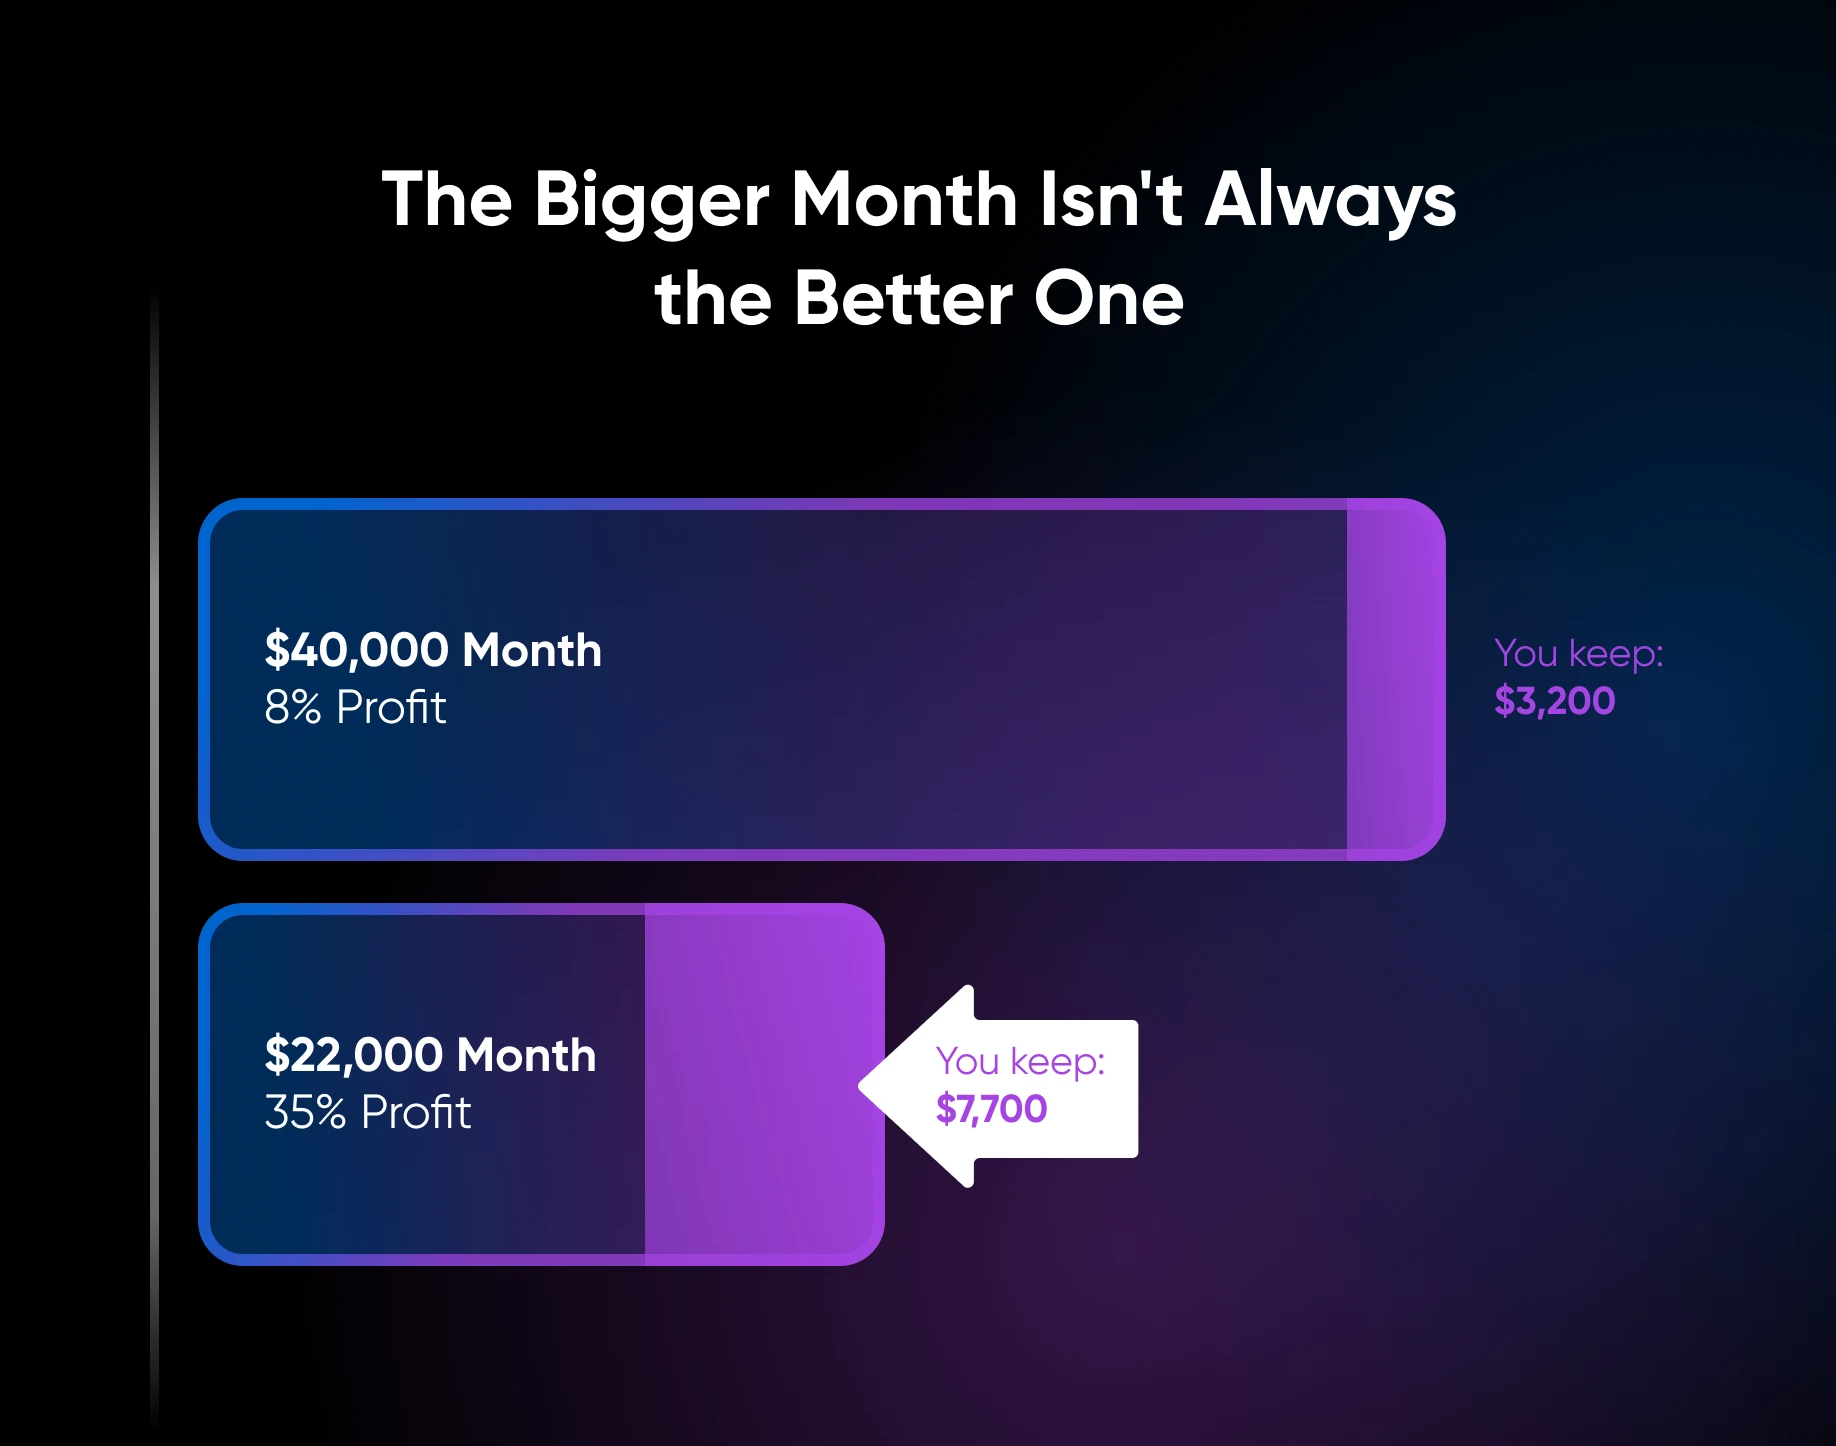
You can’t just look at revenue — revenue can rise while profit falls. Promethean Research reports that the average digital agency earned a 13% after-tax net margin in 2025 (per its April 2026 benchmarks, down from 14% in 2024), which is a useful reality check for anyone assuming agency growth automatically turns into easy profit. A $40,000 month with 8% profit is not necessarily healthier than a $22,000 month with 35% profit.
And here’s a common agency pitfall to watch out for: you can sell a project profitably but end up losing money if it goes over scope. A $10,000 project with a 30% target margin means $7,000 budgeted for delivery. But if scope creep pushes delivery to $8,500, your margin drops to 15% before overhead.
Pricing for agency overhead
One of the biggest mistakes a new agency can make is charging freelance rates with agency costs. When you were solo, your overhead was likely low, but agency overhead includes salaries, payroll taxes, benefits, project management tools, accounting, insurance, legal costs, and unbilled hours for internal projects, professional development, and sick days.
👉 A useful rule of thumb: Bill 2.5–3x your team’s fully loaded hourly cost. Agency profitability consultancy Parakeeto puts the floor at 2.5x fully loaded cost per hour, and a salary-based version of the same rule says revenue-generating employees should bring in 2 to 3 times their salary cost. At the 3x end, the rate splits into roughly equal thirds for delivery, overhead, and profit. So if a designer costs you $50/hour fully loaded, the client rate should be at least $125/hour, and $150/hour at the 3x target. Below about 2.5x, there’s little left for overhead and profit once delivery is paid for.
Most new agency owners undercharge in year one. They usually know the math, but the number feels bold. It gets easier. Quote it anyway.
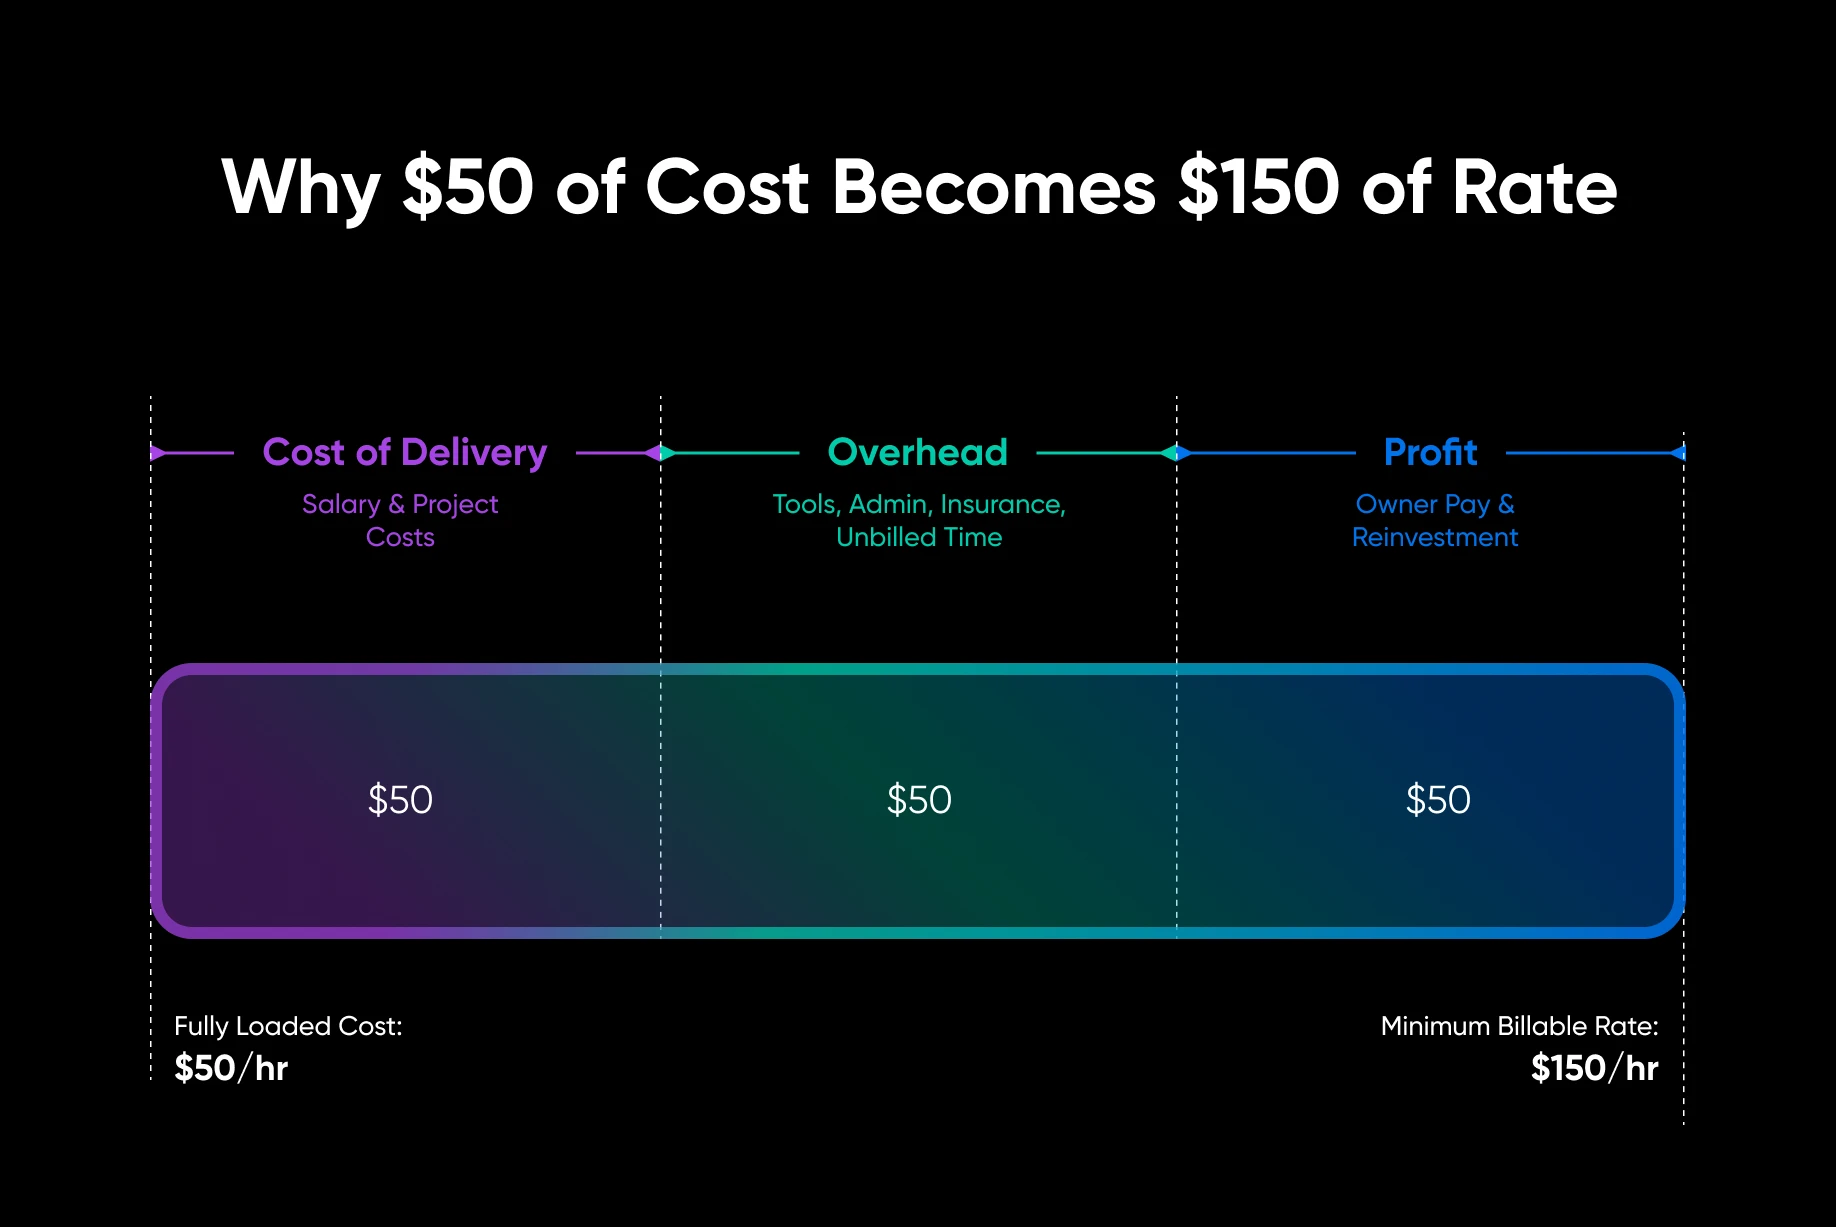
Here’s how the multiplier breaks down at the 3x target:
| Component | Percentage of Billable Rate | What It Covers |
| Cost of delivery | ~33% | Salary Contractor costs Direct project expenses |
| Overhead | ~33% | Rent Tools Admin Insurance Unbilled time |
| Profit | ~33% | Business profit Owner distributions (beyond your market-rate salary) Reinvestment |
Utilization rates and capacity
Utilization rate measures what percentage of available hours go to billable client work versus internal meetings, admin, and everything else that doesn’t generate revenue.
If someone works 40 hours per week, they won’t spend 40 hours on billable client delivery — they need time for meetings, admin, training, internal communication, breaks, and the simple fact that no human operates at 100% efficiency and productivity.
So what’s healthy? Per Harvest’s agency utilization benchmarks, most agencies run at 55–60% utilization, and a realistic target for service businesses is 70–80%. Roles built around delivery can sit near the top of that range, while roles that carry management, sales, or internal work (project managers, founders) will naturally land lower — and a founder’s utilization should generally fall over time as the team grows.
These are targets rather than rigid rules. A week at 60% happens. A month at 60% is a signal worth looking at.
Higher isn’t always better; if utilization is too high, people have no room for improvement, training, sales support, unexpected client needs, or rest.
Bench time is the opposite problem: a team member is available, billable, and not billing anything. It feels fine right up until payroll clears. Some bench time is normal, but too much of it could mean you hired ahead of demand or your sales have slowed down.
Managing freelancer and contractor costs
The way to manage freelancer and contractor costs is to treat contractors as flexible capacity: mark up their rates like any other cost of delivery, convert a contractor to a hire only when recurring hours justify it, and keep classification and admin clean so the savings aren’t eaten by risk and overhead.
The flexibility is the point. The real fix for bench time is usually structural: a stronger pipeline keeps it rare, and flexible contractor arrangements mean you’re not locked into full-time costs during slow stretches.
But that only works if you price contractor work correctly. A contractor’s invoice represents your cost of delivery, rather than the client rate. If a contractor charges you $85/hour, the client rate still needs to cover overhead and profit on top of that $85 — the same multiplier logic as employee time. Pass a contractor’s rate straight through and you’ve turned their work into unpaid admin for your agency.
Contractors look expensive per hour and cheap per year, until the hours pile up. Run the break-even: say a contractor charges $85/hour, and a comparable full-time hire would cost $50/hour fully loaded, or about $104,000 a year at 2,080 working hours. At 800 contractor hours a year, you pay $68,000, and only for hours tied to real work. But $104,000 ÷ $85 is roughly 1,220 hours, about 60% of a full-time schedule, and past that point the contractor costs more than the hire. A practical rule of thumb: when a contractor consistently books more than half a full-time load for two or three quarters, run the numbers on hiring.
Classification matters too. A contractor you schedule, direct, and equip like an employee may legally be an employee, and misclassification can mean back taxes and penalties. When in doubt, review the IRS guidance on independent contractor vs. employee status before you structure the arrangement, rather than afterward.
Finally, build a small, reusable bench instead of sourcing fresh talent for every project. Two or three proven contractors per discipline, with agreed rates and a standing contract, cost far less to activate than a cold search — and they keep contractor admin (contracts, invoices, tax forms) a routine instead of a scramble.
Cash flow management
Cash flow management means making sure money arrives before it has to leave. An agency can be profitable on paper and still miss payroll, because payroll is due every two weeks while client invoices might not be due for 30, 45, or 60 days.
Close the gap on the invoicing side first. Take a deposit before work starts, and bill the remainder at defined milestones rather than in one invoice at delivery. Retainers help for the same reason: the revenue lands on a predictable monthly cadence, which is exactly what payroll demands. (That’s the recurring revenue ratio in the dashboard below.)
Then manage the terms. Set payment terms deliberately instead of accepting whatever a client’s procurement team defaults to, invoice the moment a milestone is reached, and automate reminders so chasing money isn’t a founder task. For chronically late payers, put the consequence in the contract up front — work pauses when an invoice goes seriously overdue — so enforcing it becomes standard policy rather than a confrontation.
And keep a buffer. Aim for a cash reserve that covers 2 to 3 months of payroll and fixed costs. That’s what turns a slow month or a late-paying client from a crisis into an annoyance.
How to increase agency profit (without raising prices)
Improving profitability doesn’t always mean charging more.
You can also improve profit by tightening scope, reducing rework, improving handoffs, standardizing deliverables, selling retainers, or dropping low-margin services. AI-assisted delivery has become a real lever here too: using AI tools for first drafts, boilerplate production work, and internal admin and reporting cuts the hours behind each deliverable without touching the price.
Common areas where profit margins narrow include:
- Selling custom work at package prices
- Making unlimited revisions
- Redoing team work yourself
- Letting the scope change without a formal agreement
- Letting projects drag past their agreed-upon timelines
- Not charging for maintenance or support
- Not charging for strategy
- Having too many tools with overlapping functions
Scope management is often your biggest profitability lever. Most project overruns are caused by scope that creeps and expands without corresponding fee increases. Define the scope precisely in every contract, include a clear change order process, and train your team to flag out-of-scope requests before working on them.
Tools deserve one more note: cut the overlap, but keep the categories that feed your numbers. Time tracking, project-level accounting, and expense tracking are what turn “I think this project made money” into a margin you can act on — and a short written procedure for each routine financial task (invoicing, payroll, month-end review) keeps them getting done the same way every time.
Build an agency profitability dashboard
Build a simple spreadsheet with these five numbers and update it monthly.
- Fully loaded team cost per hour: (annual salaries/wages + taxes + benefits)/annual working hours = $____/hour
- Minimum billable rate: Cost per hour x 2.5 (floor) to x 3 (target) = $____/hour
- Utilization rate: Last month’s billable hours/total available hours = ____%
- Monthly break-even: Total fixed costs/target gross margin = $____
- Recurring revenue ratio: monthly recurring revenue/total revenue = ____%
A spreadsheet is the right tool until it isn’t. A rough progression: bring in a bookkeeper as soon as categorizing transactions eats your evenings, an accountant once payroll and taxes get real, and a fractional CFO when decisions like hiring, pricing changes, or financing need someone who models scenarios instead of recording history. Founder-run books are fine at the start, but they can become a quiet risk once the team and client list grow.
Keep the business healthy enough to do its best work
Profitability means building an agency that can keep its promises, pay its team, invest in better systems, give clients a smoother experience, and survive the occasional slow month without panic.
That’s the real point of financial discipline. It gives the agency room to breathe.
Agency finance FAQs
How do I manage agency finances?
Track five numbers monthly: fully loaded cost per hour, minimum billable rate (2.5–3x cost per hour), utilization rate, monthly break-even, and recurring revenue ratio. Price above fully loaded labor cost, control scope with change orders, bill on deposits and milestones, and keep 2 to 3 months of costs in reserve.
What is a good profit margin for a digital agency?
Promethean Research (April 2026) reports the average digital agency earned a 13% after-tax net margin in 2025 and says a typical agency should expect 10–20%. Above 20% usually means a lean, focused shop; below 10% usually signals pricing, utilization, or overhead problems.
How can agencies protect margins while managing client media budgets?
Keep media spend out of your revenue. Bill ad budgets as a client-funded pass-through, or have clients pay platforms directly, and charge your management fee separately. Your margin lives in the fee; mixing media dollars into revenue inflates the top line and hides whether the work itself is profitable.
How can an agency reduce costs without layoffs?
Cut tools with overlapping functions, shift variable work to contractors, tighten scope so rework drops, and stop absorbing unpaid revisions. Most agency cost problems are delivery-efficiency problems: the same team shipping the same work in fewer hours is a cost cut with no layoff attached.
When should an agency hire instead of using a contractor?
Use contractors when demand is uneven or a skill is needed occasionally; hire when the hours recur. Once a contractor consistently books more than about half a full-time schedule, compare their annual cost with a fully loaded salary — by then, the contractor is often the more expensive option.

Stop Chasing Invoices. Automate Your Business Finances.
A free playbook for small businesses: automate expense tracking, payments, cash flow forecasting, and tax prep from one connected system.
Get the Free eBook