
Core Web Vitals is one of the ranking factors on Google. This means that running performance tests becomes mandatory for all website owners who want better search engine optimization (SEO).
For over a decade, GTmetrix was the default recommendation for anyone who needed a quick look at their site speed. It was fast, simple, and most importantly, it was generous — but we say “was” because, by late 2023 and mid 2024, that generosity had evaporated.
With new paywalls blocking essential features, severe limits on free testing, and mobile analysis locked behind a subscription, the tool we all bookmarked is no longer the paragon it once was.
Luckily, there’s WebPageTest.org (WPT), a platform that’s been sitting in the background since 2008, powering the internet’s most rigorous performance audits.
So, we tested WPT across major website performance parameters to determine if it can replace other speed testing tools, like GTmetrix, without any compromises.
Walk with us.
What Are The Origins of WebPageTest.org?
WebPageTest.org is an open-source performance testing platform that provides deep diagnostics for web pages. It began as a project within AOL and was later developed by Patrick Meenan at Google to help engineers understand browser behavior.
The tool has remained active for over sixteen years because it is supported by a community of performance specialists who believe in contributing to open source.
In fact, performance engineers built this tool specifically for other performance engineers who require high-fidelity data. Every test runs on a real browser, whether it’s Chrome, Firefox, or Safari, rather than a headless simulation that might miss rendering bugs. This technical foundation ensures that the results reflect what an actual human visitor experiences on their device.
The project moved to Catchpoint in 2020 to guarantee it had the resources to stay free for the public. Now, instead of just subscriptions, WPT is funded by an enterprise parent company that uses the data for its own research.
How Does the Feature Set Compare for Daily Use?
We also need to see how WPT handles the website metrics that actually matter for your daily workflow. If you’re coming from GTmetrix, the feature set here will feel familiar, but the depth of data is significantly higher.
Core Web Vitals Monitoring
WebPageTest does not just give you a pass/fail grade — it breaks down Core Web Vitals (LCP, CLS, INP) with a level of granularity that Insights often hides.
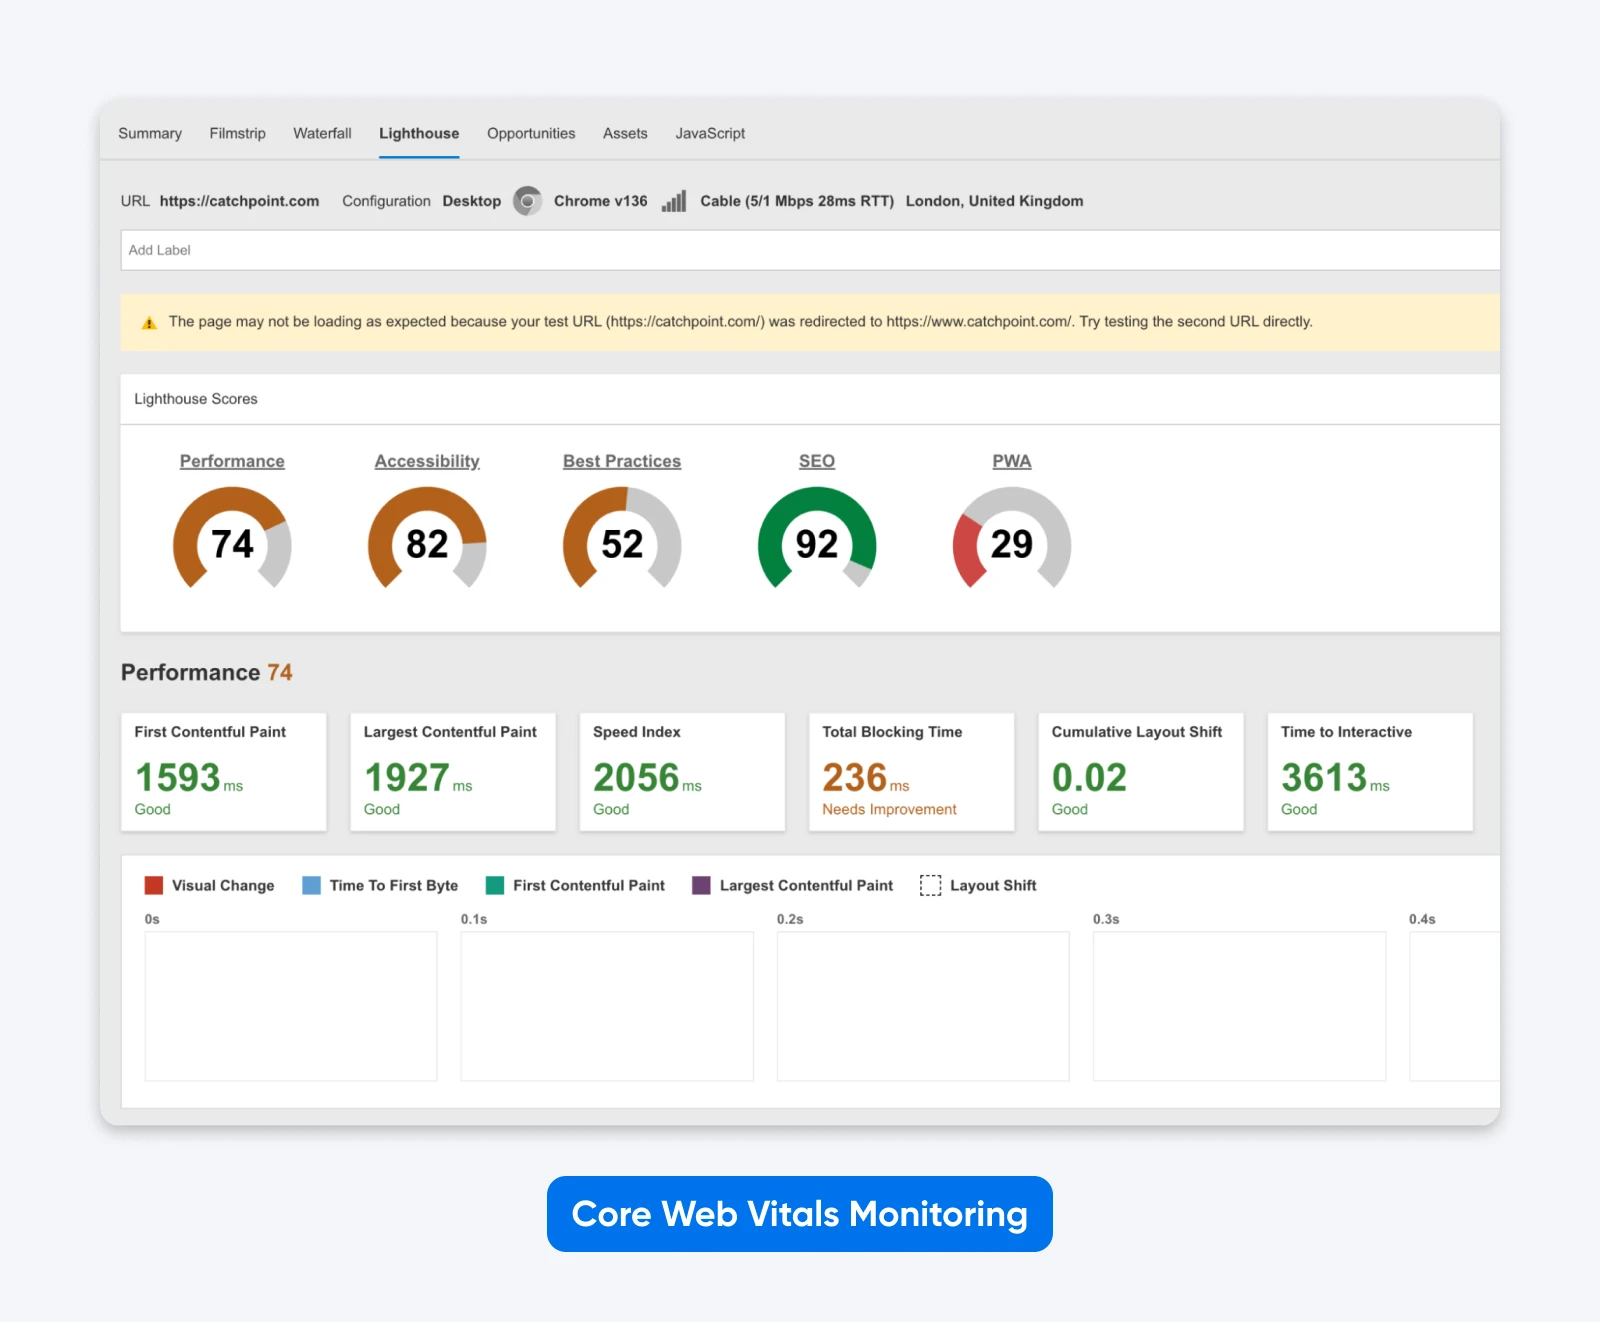
When you run a test, WPT visualizes these website metrics on a timeline. Instead of just telling you “Your Cumulative Layout Shift is 0.25,” it highlights the exact frame in the loading sequence where the shift happened.
This is critical for debugging because you can see the exact layout before the jump and the layout after.
It also introduces “Opportunities,” a section that mirrors the “Recommendations” from GTmetrix that we’re used to, but with better prioritization.
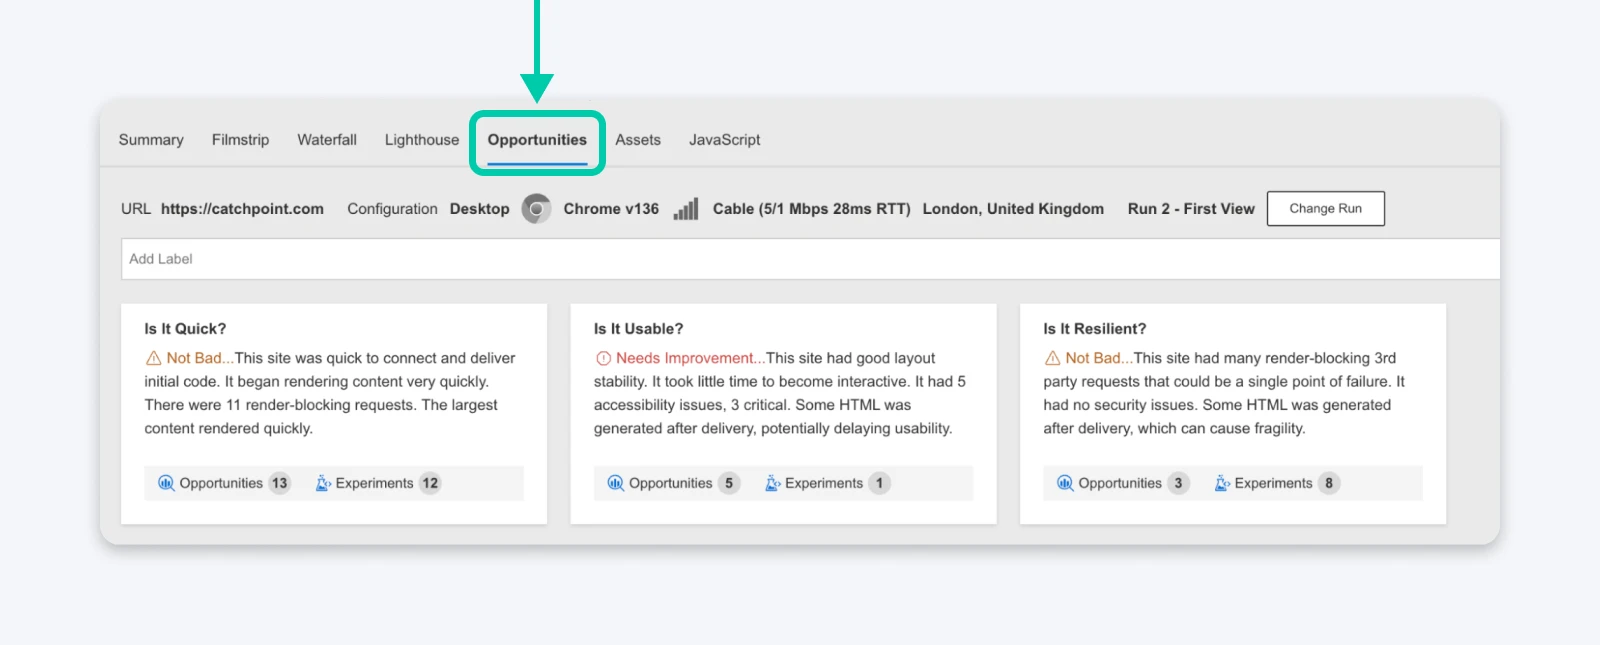
If you have 10 issues, WPT helps identify which of those don’t matter for immediate performance gains and which to focus on to actually improve SEO and website speed.
Waterfall Charts and Request Analysis
The waterfall chart is the crown jewel of WebPageTest: it’s dense, colorful, and initially terrifying. But once you learn to read it, you will never want to go back to a simplified list.
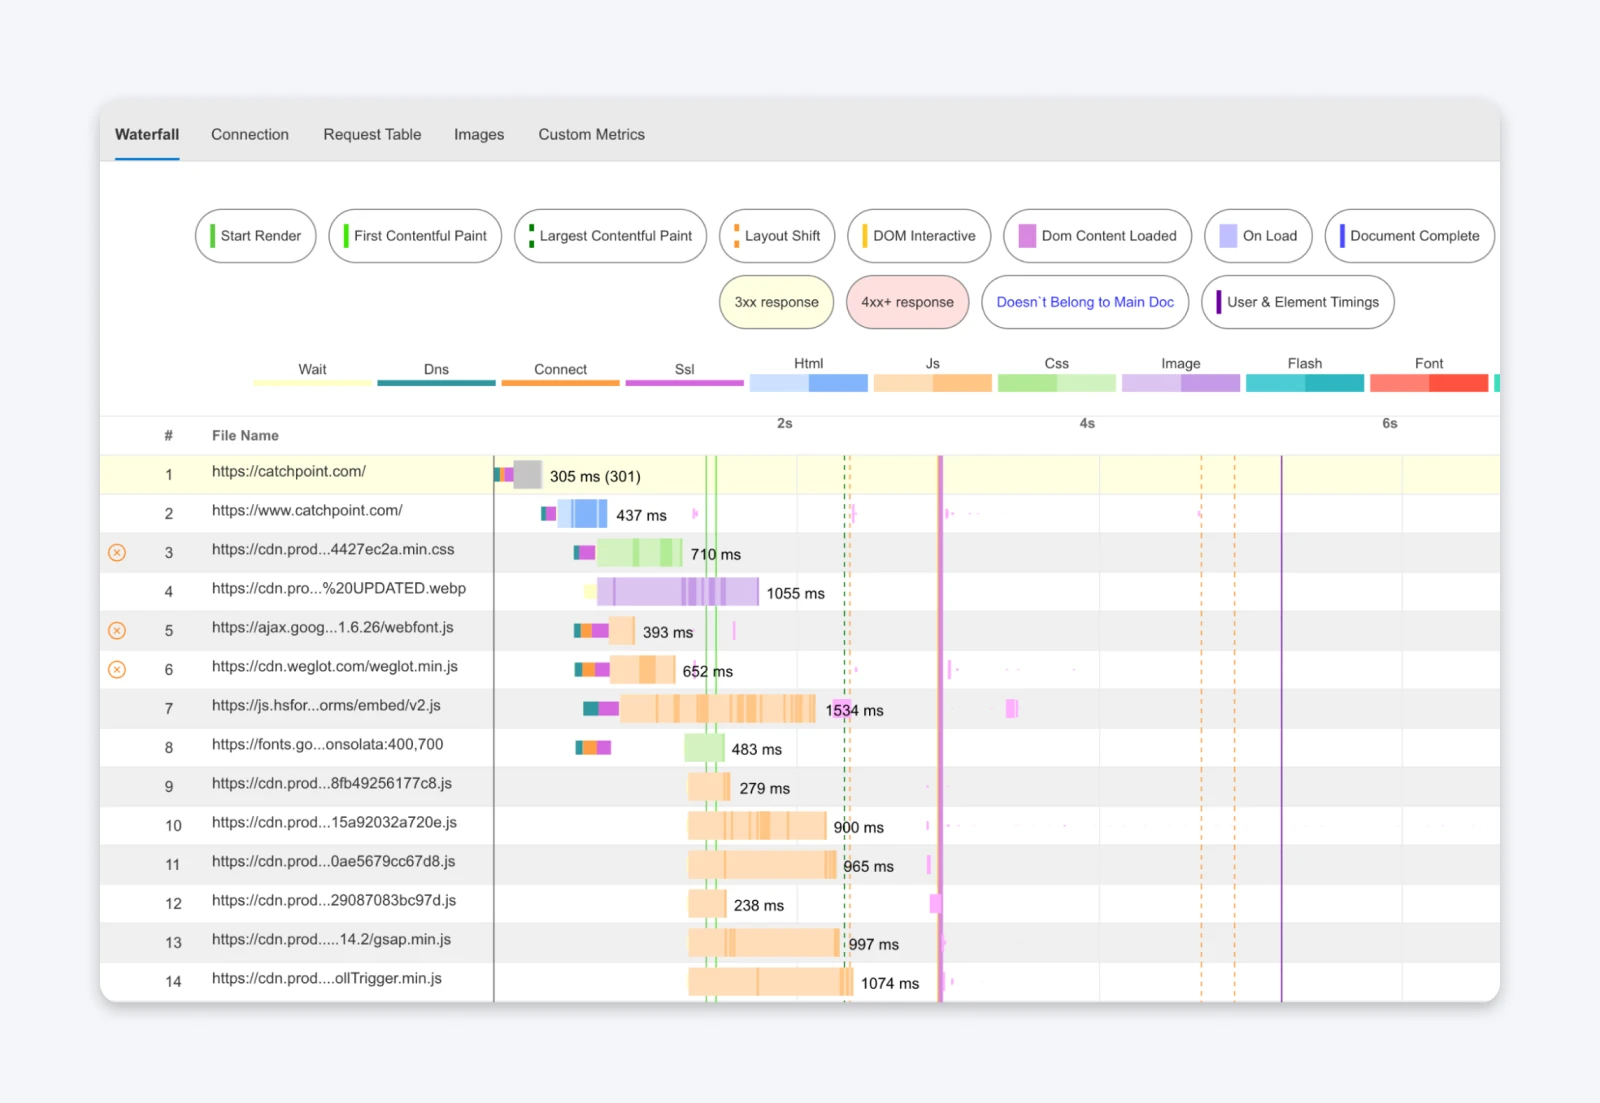
The free tier of GTmetrix showed only a basic list of files here. WebPageTest shows every single request, broken down into five to ten distinct phases, color-coded for diagnosis:
- DNS and Connect: This shows how long it took just to find the server. Long bars here mean your DNS provider is slow.
- SSL Negotiation: This shows the time spent establishing a secure connection. If this is huge, your server’s TLS configuration might be outdated.
- Time to First Byte: TTFB is the time it takes for the browser to receive the first byte of the server’s response. A long bar indicates a slow server response time, which often points to issues with database queries or server-side processing (indicating it’s time for database optimization)
- Content Download: The browser is actually receiving data.
The most powerful feature here is the “Connection” view.
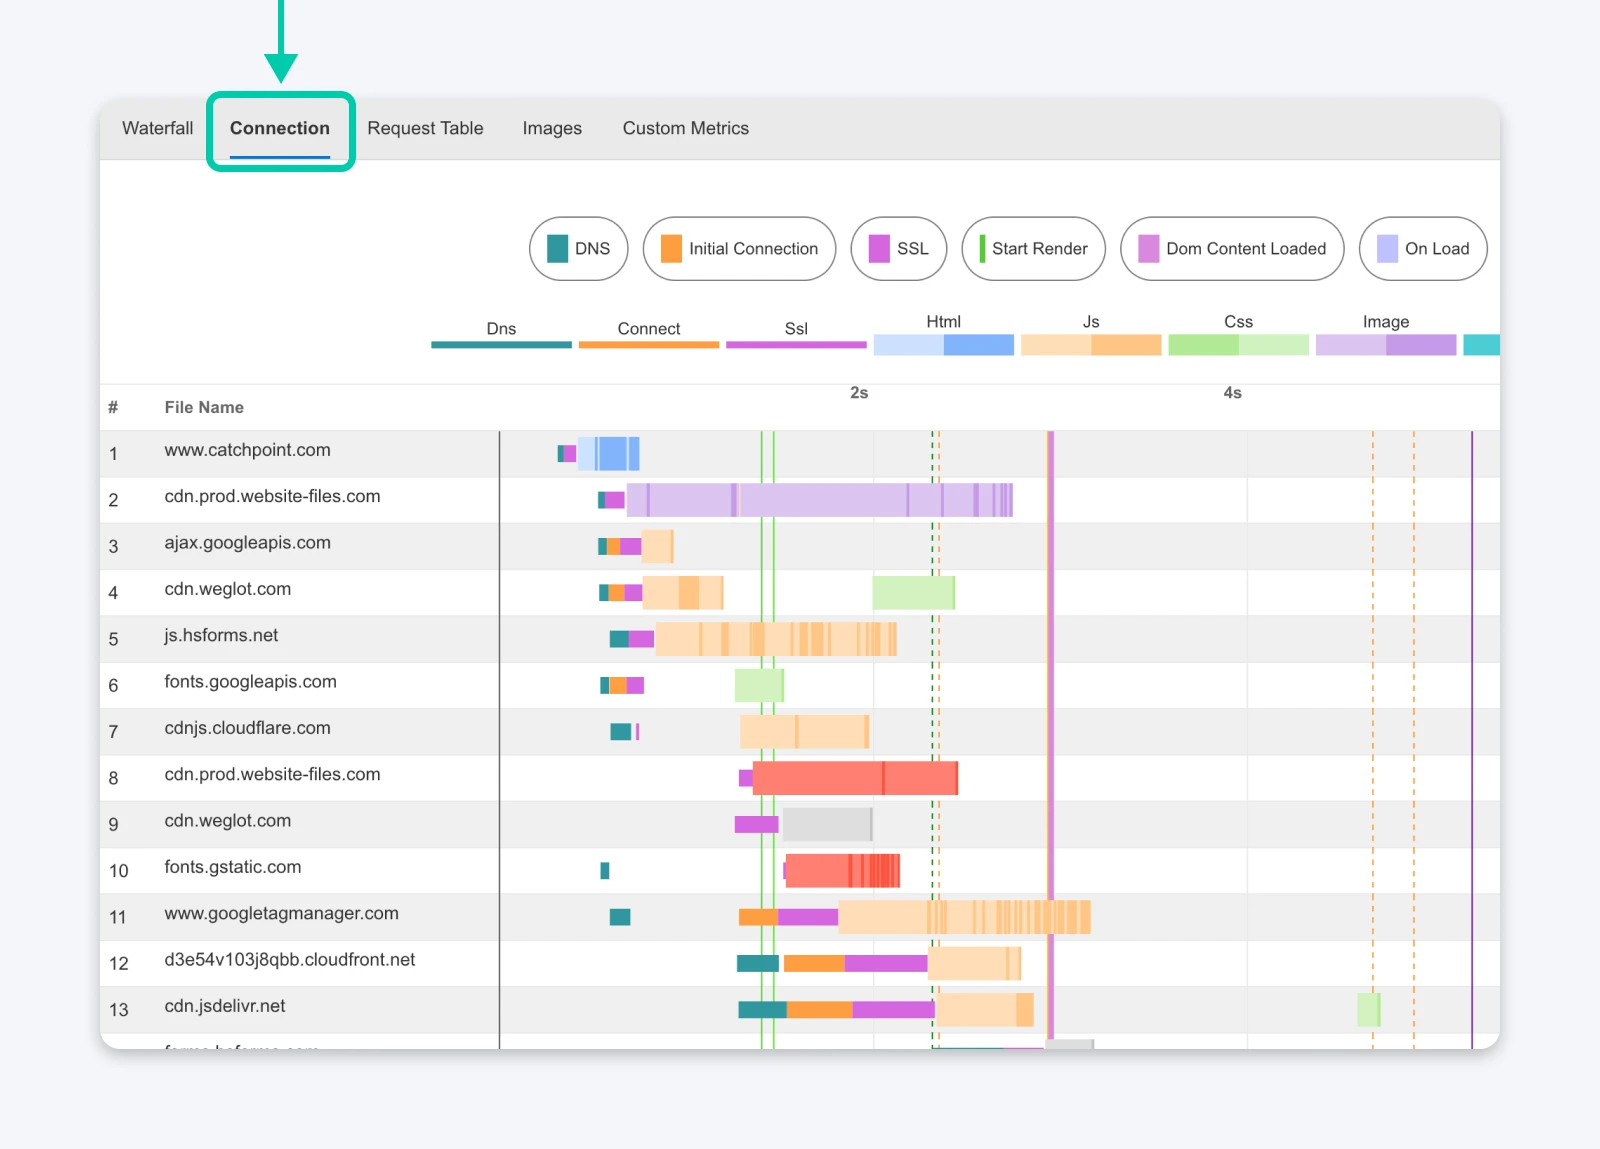
You can see exactly how the browser opens parallel connections to download images and spot the exact moment a third-party tracking script blocks the rest of your site from loading.
Performance Recommendations
All suggestions by WPT are context-aware. Instead of a generic checklist, WebPageTest uses its “Opportunities” and “Experiments” engine.
Rather than suggesting “Defer JavaScript,” it identifies the specific bundles blocking the main thread and suggests you run a test without them.
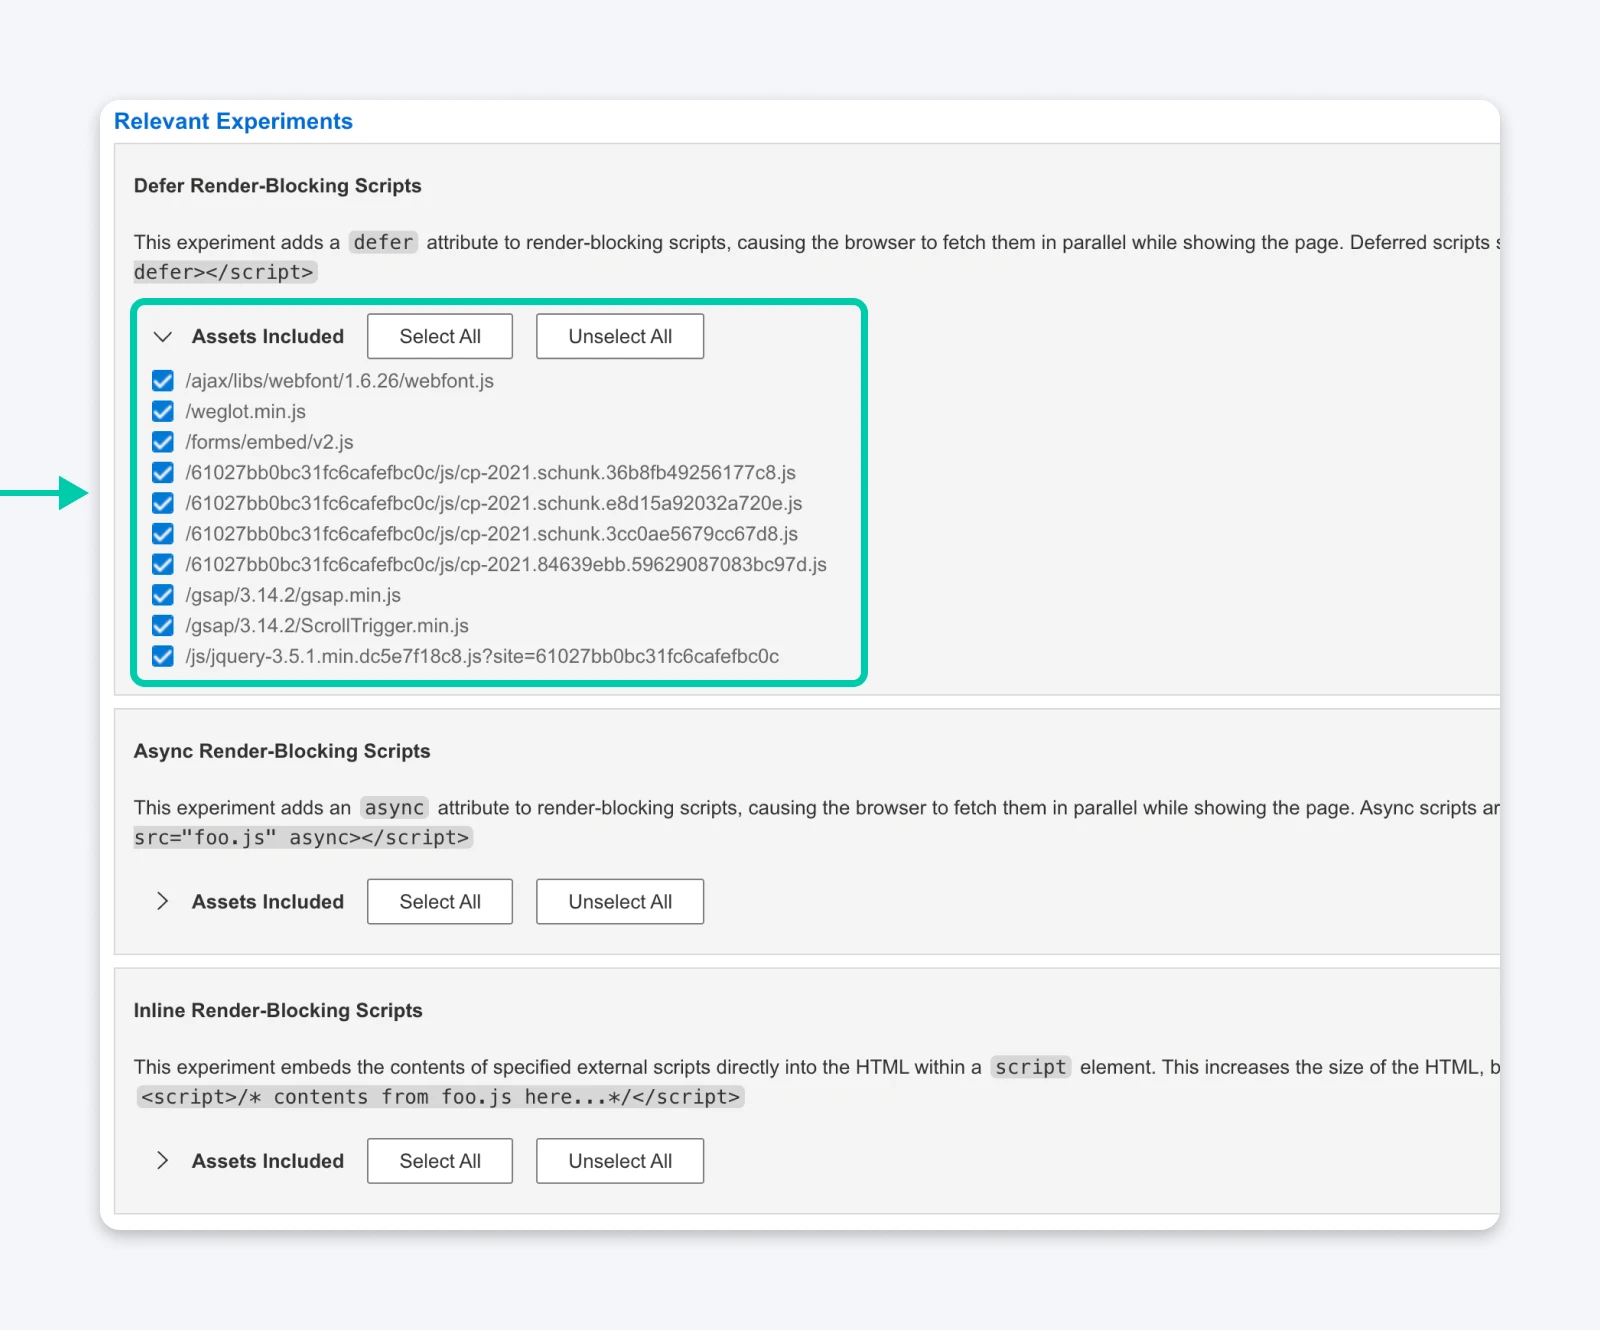
Even more impressive is the “No-Code Experiments” feature. This allows you to “test” a fix without actually changing your code. It will rewrite the HTML on the fly and give you a result. This saves hours of development time. You can prove a fix works before you ask your developer to implement it.
✏️Note: This is a paid feature so you may need to figure out if the costs are justified for your use case.
Testing Locations and Devices
This is the killer feature. Most free tools simply cannot afford to offer multiple test locations and devices. WPT can. Open the locations modal and you’ll see all the available cities and countries.
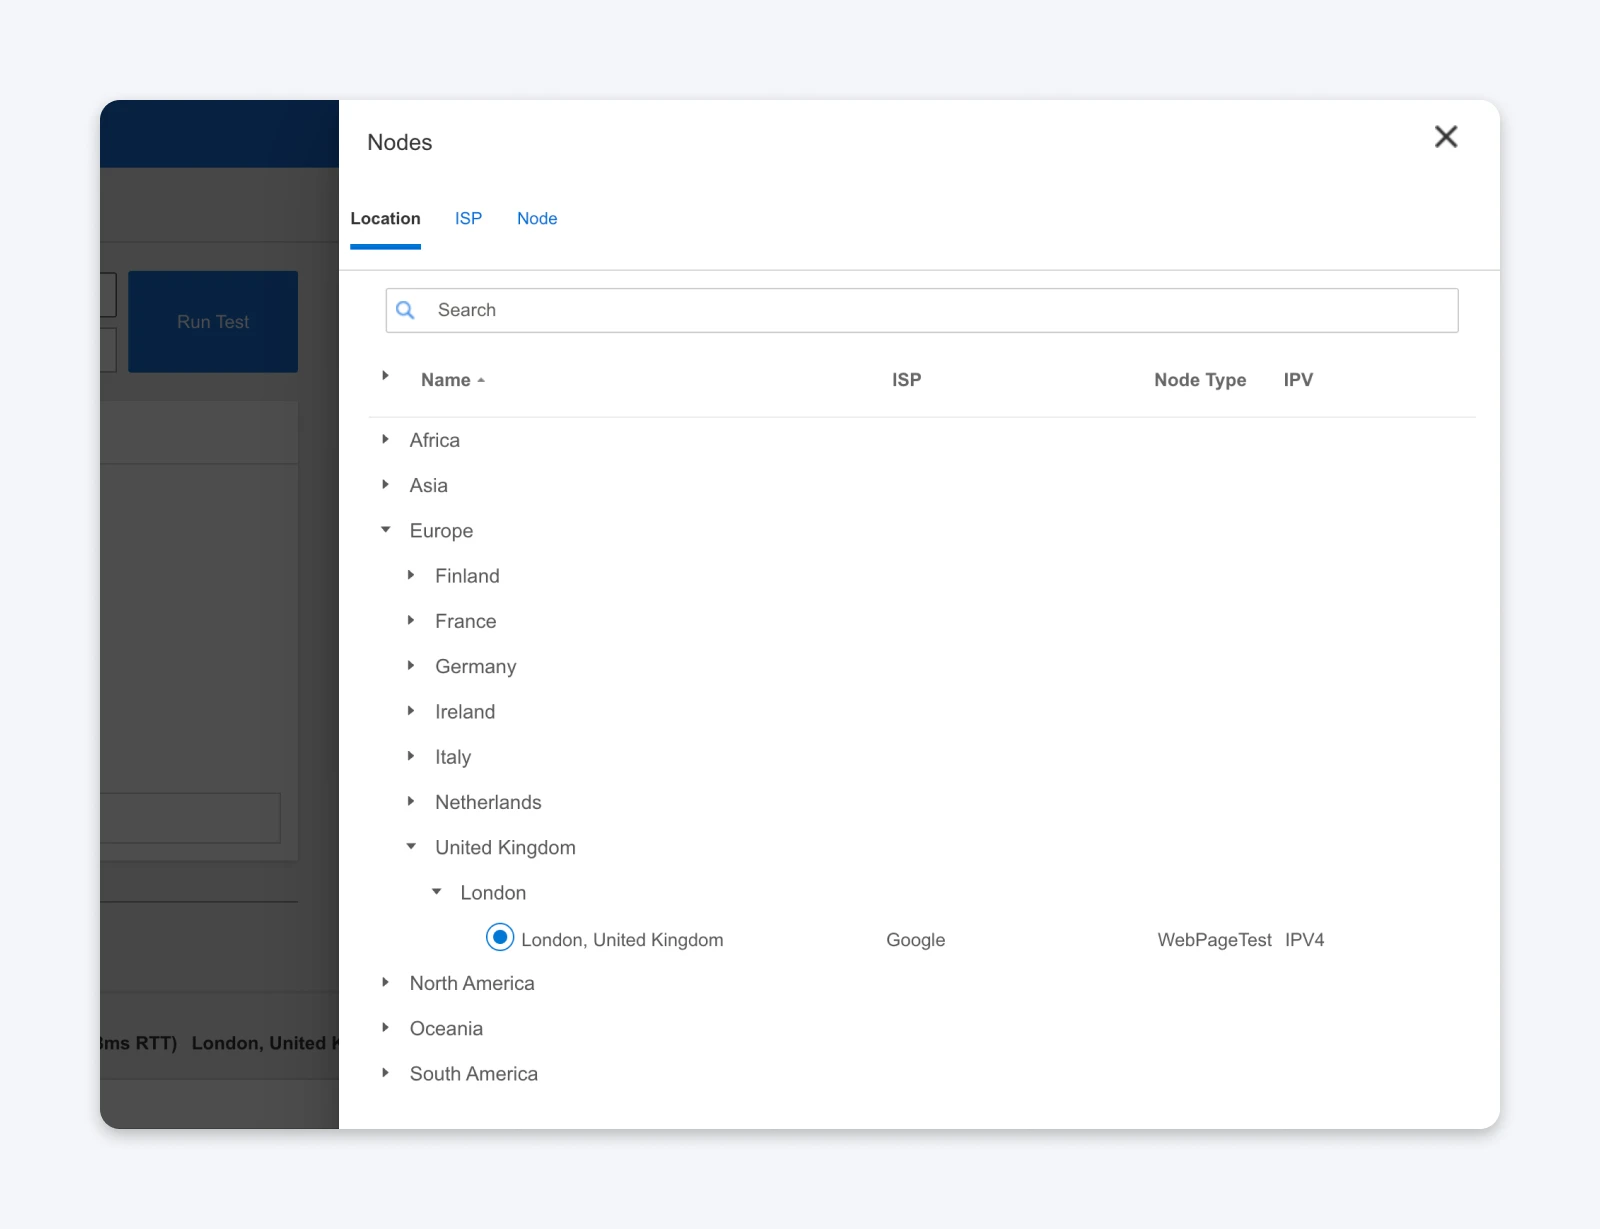
To top that up, the company also offers ISP and Node if you want to test on specific networks. Apart from that, WPT emulates hundreds of devices and browser versions (and also runs a few real-devices), to run your tests from.
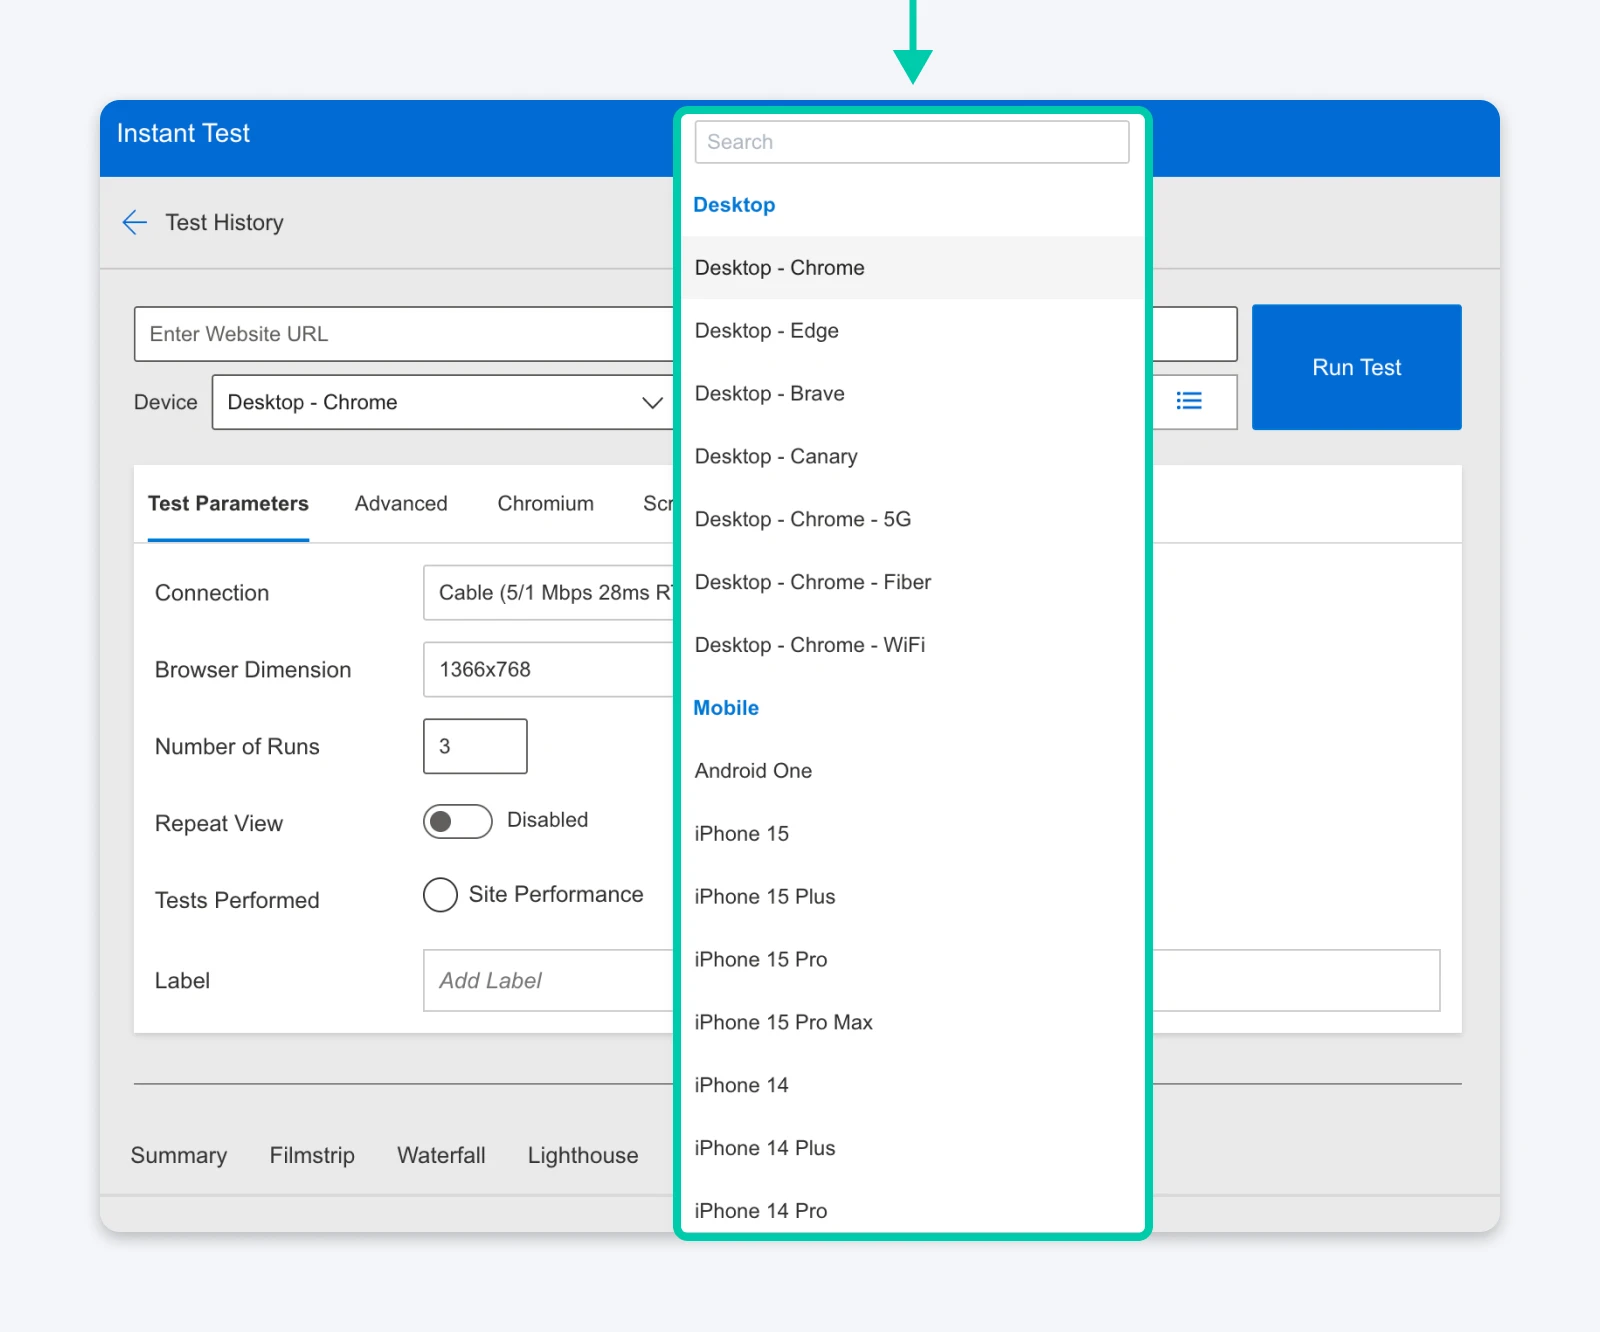
If your audience is from London and a majority of the users have an iPhone 14, you can create this specific combination to run your tests and get the most accurate results.
Advanced Features in WebPageTest.org
There are two features that set WPT apart for developers: “Scripting” and the “Filmstrip” View.
Scripting is an advanced feature that allows you to automate complex tasks. For instance, you can write a short script to tell the browser to log into your site before starting the test. This lets you measure the speed of your member dashboard or checkout page.
Most free tools only let you test public pages that don’t require a password. This capability makes the platform a powerful diagnostic tool for web applications.
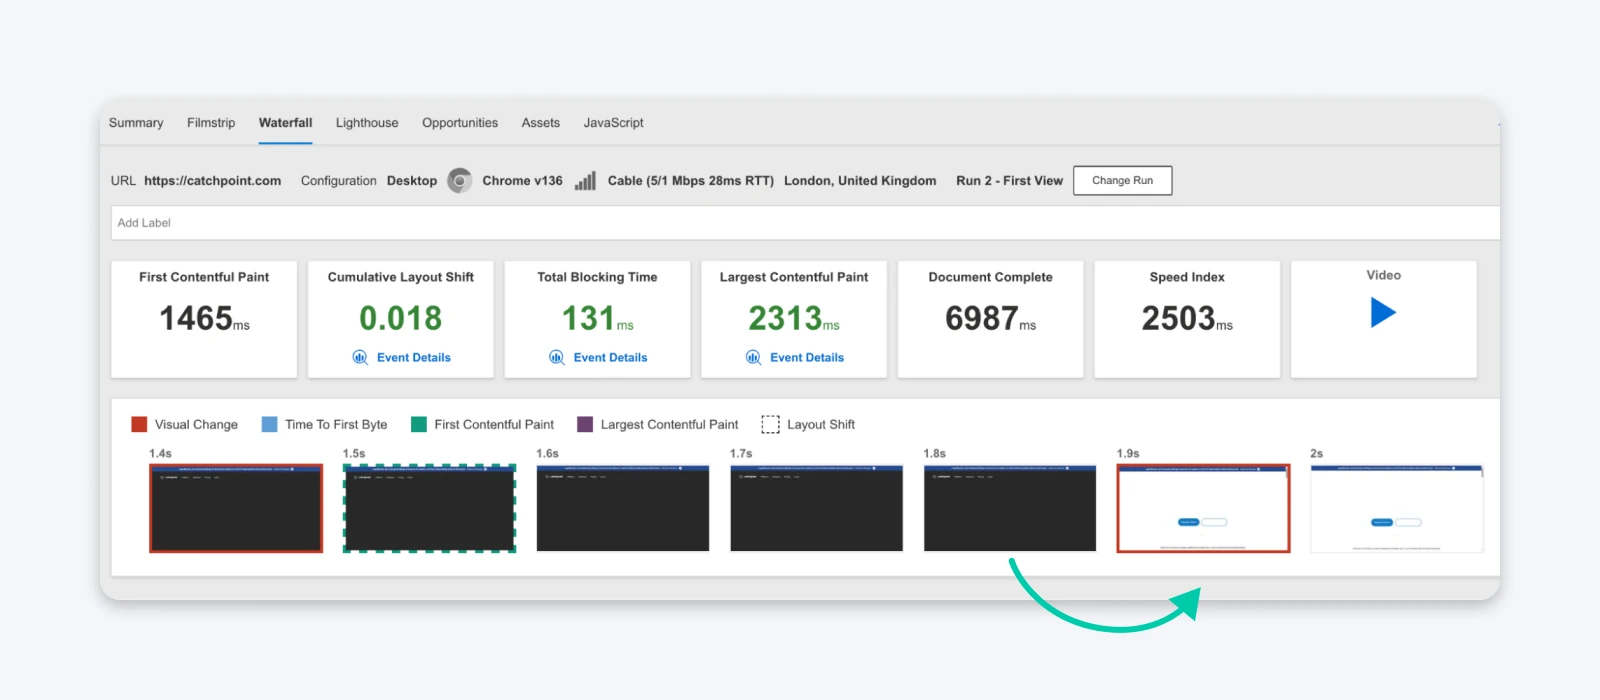
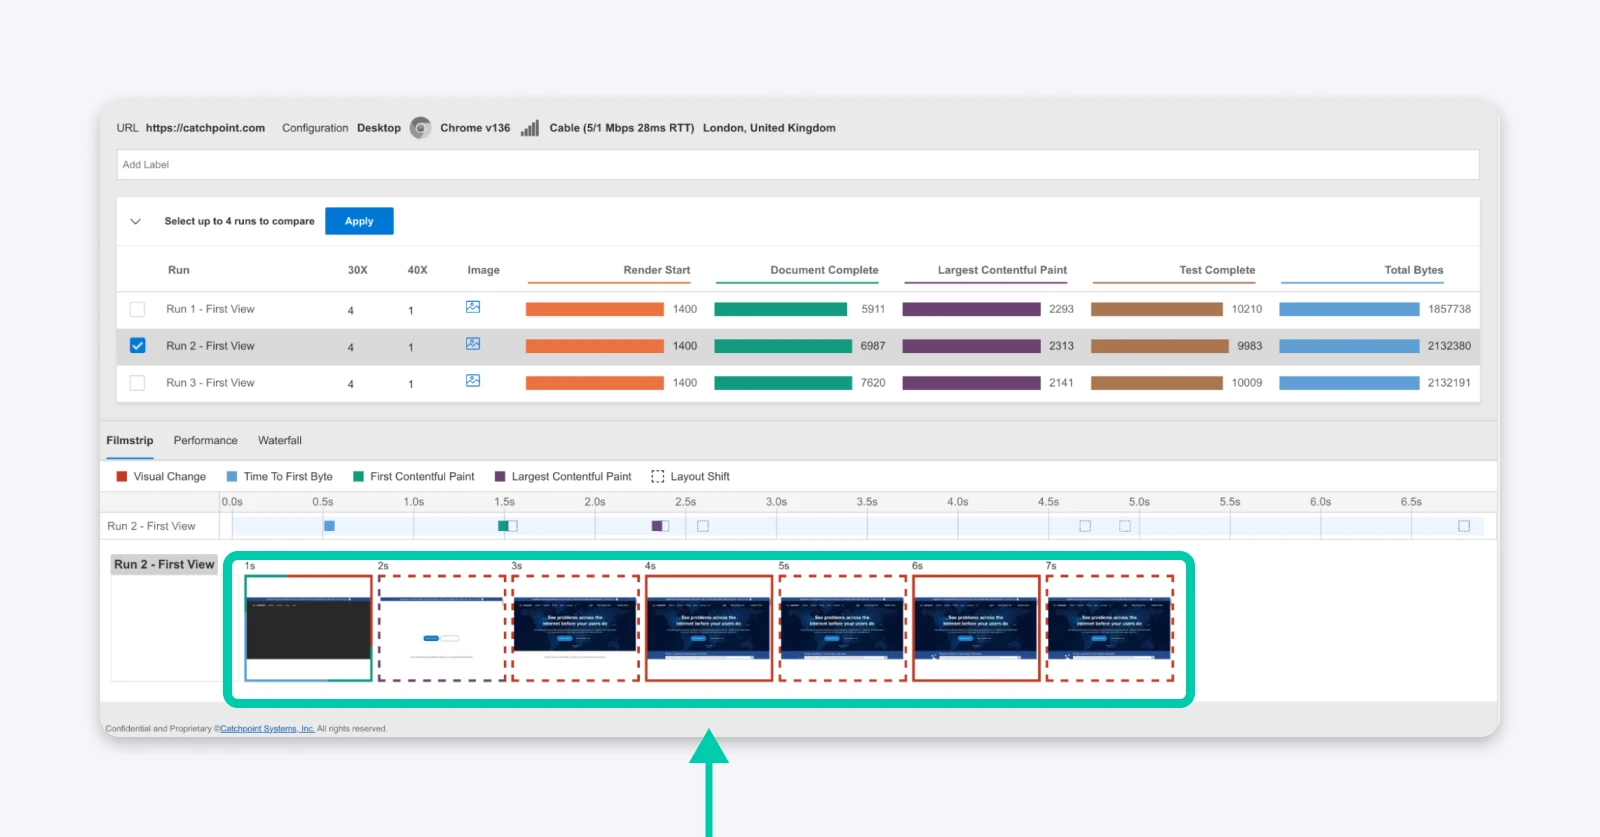
The Filmstrip view is another advanced feature that captures a screenshot of your site every 0.1 to 0.5 seconds as it loads. You can scroll through these images, frame-by-frame, to see exactly what a visitor sees in their browser.
This feature helps you spot visual issues, like fonts changing size or images popping in late, that may not be visible in code. You can also use comparison mode to look at two different tests side-by-side. This is helpful when you want to see if a change you made actually improved the speed.
The “Green” Bonus With Carbon Control
WPT introduced a feature that addresses the environmental impact of our digital infrastructure called Carbon Control.
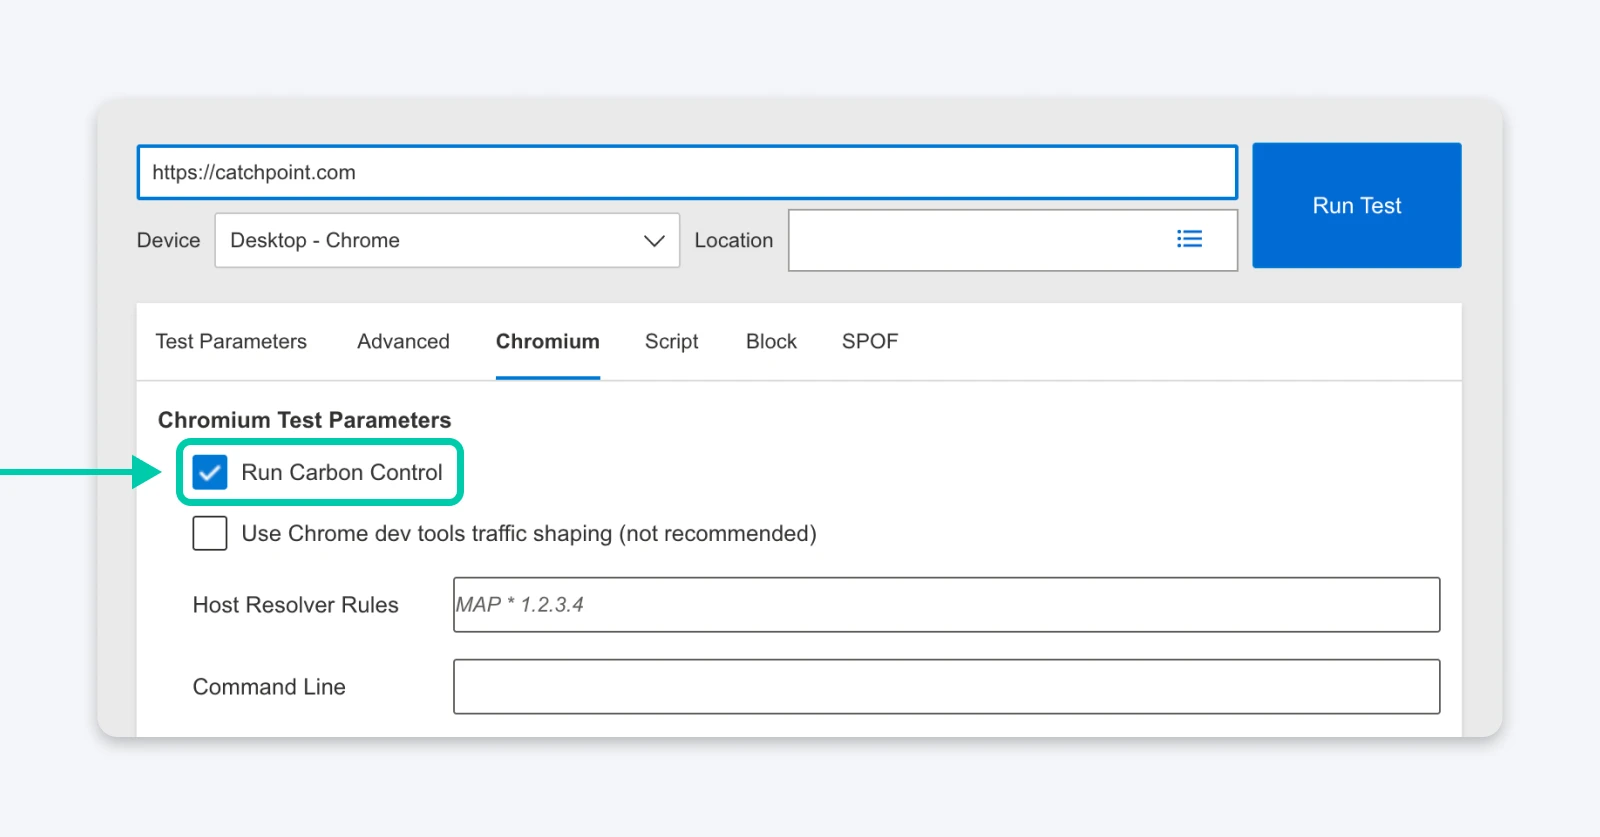
It uses the CO2.js library from the Green Web Foundation to estimate the carbon emissions generated by a single page load.
The calculation relies on two main factors to determine your score.
- Data transfer size: The total amount of data (in kilobytes or megabytes) that must travel from the server to the user’s device. Heavier pages require more electricity to transmit and process.
- Green hosting status: Whether the data center hosting the website runs on renewable energy sources (like wind or solar) or fossil fuels.
This adds a valuable dimension to your performance audits. You can demonstrate to a client that optimizing their code does more than improve their Google ranking. It measurably reduces the physical waste their business produces and helps them meet their own sustainability goals.
What Are the Limitations of WebPageTest?
WebPageTest is not perfect. In fact, there are days you will hate it.
- The queues: Because it uses real devices and is a public resource, you have to wait in line. If you run a test during peak hours, you might see “Position 100.” You could be waiting 10 or 20 minutes for a single test to run. GTmetrix (in the old days) was instant. WPT…let’s just say it teaches you patience.
- No “Monitoring” on free tier: You cannot set WPT to automatically test your site every morning and email you the results unless you pay for the API or a Pro plan. It is a diagnostic tool, not a monitoring system. If you want daily charts, you have to run the tests manually.
- Visual complexity: You cannot send a WebPageTest link to a non-technical client and expect them to understand it. It looks broken to the untrained eye. You will always need to interpret the data for them, whereas other tools produce PDF reports that look pretty enough to invoice for.
Is the Learning Curve Too Steep for Beginners?
We have to be honest: WebPageTest is complicated.
When you first land on the homepage, there are drop-downs everywhere. The results page is a wall of numbers. There is no smiling mascot telling you “Good Job!”
How to start without getting overwhelmed:
- Ignore the “Advanced Settings” at first: Just pick your location and browser (Chrome is fine).
- Focus on the “Web Vitals” Summary: The top of the results page has a red/green/yellow view similar to what you are used to. Start there.
- Use the “Image Analysis” tab: It is visual and easy to understand. It shows you exactly which images are too big and how much space you can save. If you see huge files here, you know you need to optimize images for the web immediately.
For a non-technical SMB owner, the tool might be too much. But for anyone who manages a site professionally, the learning curve is worth it. You are trading simplicity for accuracy.
How To Integrate WebPageTest Into Your Workflow
We need to be realistic about how this fits into a busy day. You cannot wait 20 minutes for a test result every time you save a CSS file. That’s not really an efficient way to work. The most effective way to use WebPageTest is as a specialized diagnostic tool rather than a daily monitor.
Start your routine with a fast tool like PageSpeed Insights or the Lighthouse tab in your browser developer tools. These platforms give you an instant pass or fail grade. When that grade drops, or you see a red warning you cannot explain, that is the moment to open WebPageTest.
Even with the full report, resist the urge to fix every single warning. Look at the waterfall chart and find the single longest bar. It might be a large image, or a slow third-party script, or maybe even your server.
Most of the time, fixing just that one bar may be enough to fix your issues. You might even find that simply converting files to modern image formats solves half the problem.
Should You Use WebPageTest?
We can’t have “one tool for everything” now since the web is so complicated. Instead, you need to pick the tools that make the most sense to your day-to-day workflows.
In case of WebPageTest:
- Developers should switch to it: The ability to script login flows, test on real mobile hardware, and see detailed connection views for free makes it professionally superior. It is the only free tool that gives you the data you need to actually fix the problems, not just identify them.
- SMB owners can use WebPageTest for your quarterly “Health Check”: But don’t obsess over it every day. Run a test, look at the Core Web Vitals, and send the link to your developer if things look red.
When Optimization Isn’t Enough
Optimization is ultimately a fight against latency — you could spend weeks shaving milliseconds off your scripts, but there’s only one way out of a hardware problem — moving to better hardware.
A Virtual Private Server (VPS) provides the dedicated power necessary to turn your optimized design into a fast, snappy experience. WebPageTest proves its value by identifying exactly when your infrastructure is holding you back. It separates the issues you can fix with a text editor from the ones that require better infrastructure.
That, honestly, is the only way to stop chasing random lines in your code and give your site the engine it deserves.

When You Expect Performance Get DreamHost VPS
Big or small, website or application – we have a VPS configuration for you.
See MoreFrequently Asked Questions
Is WebPageTest.org reliable?
Yes, WebPageTest is widely considered one of the most reliable performance tools because it uses real browsers on actual consumer hardware rather than simulations. Unlike some tools that estimate performance based on code analysis, WebPageTest records exactly what happens when a real Chrome, Firefox, or Safari browser loads your site over a real network connection.
What is the difference between WebPageTest and PageSpeed Insights?
PageSpeed Insights is primarily a reporting tool that gives you a “Pass/Fail” score based on Google’s Core Web Vitals field data (CrUX) and a quick lab test. WebPageTest is a diagnostic tool that gives you deep technical data (like waterfall charts and connection views) to help you explain why your score is low.
What is a good Core Web Vitals score?
According to Google’s benchmarks, a “Good” score means your Largest Contentful Paint (LCP) is under 2.5 seconds, your Interaction to Next Paint (INP) is under 200 milliseconds, and your Cumulative Layout Shift (CLS) is less than 0.1. Meeting these thresholds for at least 75% of your visitors is required to pass the Core Web Vitals assessment.
How often should I test my website speed?
You should run a quick check (using PageSpeed Insights) every time you publish new content or update plugins. However, you should perform a deep diagnostic test with WebPageTest once per month, or immediately after any major design changes or hosting migrations. This ensures you catch hidden performance regressions before they impact your SEO rankings.
Is WebPageTest actually free?
Yes. The “Starter” plan is free and includes 150 test runs per month, access to real mobile devices, and global test locations. They offer paid “Pro” plans starting around $180/year for features like API access, priority queuing, and “No-Code Experiments,” but the free version is more than sufficient for most developers and site owners.