20 Metrics Every Blogger Needs to Track to Measure Success

When it comes to your blog, success can come in many different forms. Regardless of your website’s niche, gathering certain data can help you determine whether your readers are loving the content you’re putting out or if you need to make some changes to increase engagement.
While collecting data about your blog might seem overwhelming at first, rest assured that there are many great tools to help you! Google itself offers several highly-valuable resources for data gathering, and once you know what to look for, finding it isn’t too tricky.
In this article, we’ll go over 20 different metrics you can track to measure your blog’s success.
- Page Views
- Traffic by Channel
- Time Spent on Page
- Bounce Rate
- Pages Per Visit
- Returning Visitors
- Top Traffic Posts
- SERP Rankings
- Average Inbound Links Per Blog Post
- Average Comments Per Blog Post
- Social Shares Per Blog Post
- Clicks from Social Platforms
- New Blog Leads and Customers
- Posts That Bring in the Most Leads and Customers
- Conversion Rates
- Lead Source Breakdown
- Total Email Subscribers
- Email Open Rates
- Email Click-Through Rates
- Number of Blog Posts Published
We’ll help you understand why this data is valuable and how to start collecting it on your own website. Ready to get started? Let’s talk blog metrics!
Traffic
Traffic measures the number of people who visit your blog. Keeping tabs on all of those visitors can provide you with valuable information about the demographics of your site’s users, as well as how you can drive more traffic to your blog.
In the following sections, we’ll be focusing on many of the tools Google provides. This is because it’s tough to beat Google’s analytics tools when it comes to gathering insights about your blog’s traffic.
1. Page Views
A “page view” is a measure of any time a user views a page on your website. This includes multiple visits and page refreshes as well. That means you’ll need to look deeper into the numbers to find out specifics about who’s visiting your blog.
Page views can often be tracked through your hosting provider. For example, our fully-hosted DreamHost plans include access to this information in your user dashboard. Alternatively, you can leverage Google’s page views tracking tool.
You can use Google Analytics to create a custom metric that uses other elements, such as session data, to provide deeper insights into audience behavior. Plus, some filters will be able to help you quickly sort out and view the most important details.
There is no one correct number when it comes to page views. It will differ radically depending on your goals, audience, niche, and so on. However, in a general sense, you should be looking for a slow but steady increase over time. If you’re not getting the numbers you expect, you may want to look into some of your other traffic metrics to fully understand where the problem lies.
Grow Your Organic Traffic with DreamHost
Our automatic updates and strong security defenses take server management off your hands so you can focus on the metrics that matter.

2. Traffic by Channel
When it comes to marketing and analytics, a “channel” is any path visitors take to reach your website and other content. For example, some users may arrive at your blog through your social media profiles (one channel) while others may get there via paid search (a second channel).
In Google Analytics, you can take your page view data and filter it by channel. Google provides a list of channel definitions as they pertain to tagging in its analytics system. This is so you can appropriately tag different funnels, to keep tabs on where your traffic is coming from.
You might want to look at all the traffic that comes to your blog via social media links, for example. You can compare that result to the traffic coming in through your email marketing campaigns. This can tell you which of your marketing campaigns are most successful and can be built upon and which might need more work to improve their Return on Investment (ROI).
3. Time Spent on Page
How long your blog’s visitors spend on the pages they visit can be a complicated metric to track. With that being said, Google does provide a solid breakdown of the averages for each page on your site.
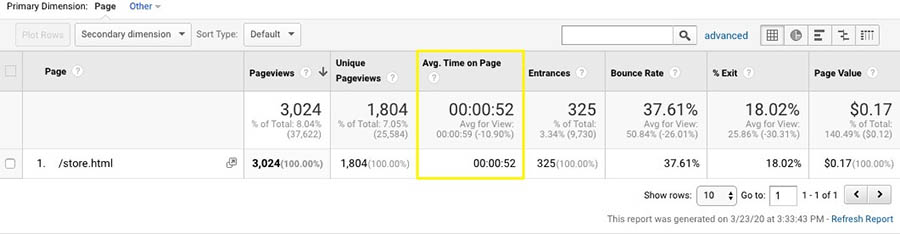
If your average “time on page” is low, you might want to look to see whether your marketing is pulling in the right kind of traffic. While the average time users spend on a web page is around 15 seconds, a well-designed page with valuable and relevant content can hold someone’s attention much longer.
Additionally, if this metric is quite low, you could have a technical issue, such as a page that loads slowly. This can lead visitors to exit as soon as they try to open that page. Fortunately, there are plenty of ways to optimize your website’s performance.
4. Bounce Rate
Your blog’s “bounce rate” is a measurement of how many viewers came to your site, took a look, had no interaction with your blog post, and then left.
Bounce rate can be a much more effective measure of reader interest than traffic stats. While a count of aggregate page views might tell you how many people visited your website, it doesn’t tell you how many stayed and explored further.
A high bounce rate may indicate that your content isn’t resonating with your audience. Alternatively, it could also be an indication that your traffic sources aren’t very good. If you’re blogging about fitness and your traffic is coming from sites about credit card debt, for example, you may have high traffic, but it’s unlikely to be traffic that is meaningful in terms of true audience building.
A bounce rate in the range of 25 percent to 40 percent is considered excellent. Anything higher than 70 percent probably indicates that your audience-building approach requires changing.
Related: 7 Steps to Identify a Target Audience for Your Online Business
5. Pages Per Visit
When you measure “pages per visit” on your website, you’ll typically start with an average of the number of pages viewed over a given hour or day, divided by the number of site visitors during that same time frame. This can give you an idea of how users are interacting with your blog.
If you have pretty substantial traffic overall, but your pages per visit average is on the low side, you might want to investigate your linking strategy.
For example, if you have content with a lot of external links but not many internal links, you might be losing visitors who might otherwise stay on your website and explore your other content.
6. Returning Visitors
When you look at your “returning visitor” numbers versus your “new visitor” numbers, there are some assumptions you can make about your blog’s overall traffic. You’ll be able to see whether your readership is growing, staying steady mainly due to loyal regulars, or declining.
You can view these stats by going to Behavior > Overview > +New Segment in your Google Analytics dashboard. Alternatively, you can install the MonsterInsights plugin.

This is the most popular WordPress plugin for Google Analytics. It enables you to display your data right in your dashboard, so you don’t have to go to another page to view it.
If you aren’t seeing a lot of return visitors, you may be attracting readers but struggling to really catch their attention. In that case, you’ll want to work on improving engagement on your blog.
7. Top Traffic Posts
Tracking your top posts can tell you what kind of content is hitting home with your readers. This can help you determine where to focus resources or how to best increase your content output.
For example, your audience might respond more favorably to video than text-based content or vice versa.
One of the ways you can use “top blog post” data is by guiding visitors to content that others have found valuable. If you’re willing to experiment with adding some code to your site, you can even display a “popular posts” tab to highlight content based on traffic counts.
SEO
Search Engine Optimization (SEO) encompasses several tactics that work together to improve your site’s rankings in Search Engine Results Pages (SERPs). A variety of elements on your website contribute to its SEO, many of which can be measured.
8. SERP Rankings
SERPs are the lists of results returned by search engine queries. Each of your blog’s pages will fall on different positions in SERPs for relevant keywords and phrases.
One tool you can use to track your SERP rankings is the Ahrefs Rank Tracker.
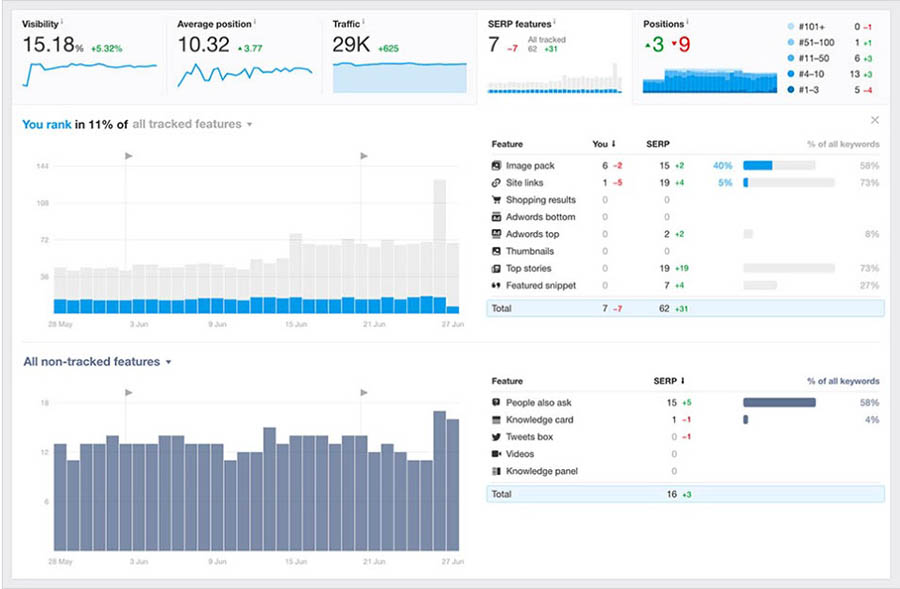
Ahrefs offers a suite of tools, but you can also choose just the ones you want. This solution will enable you to get an accurate picture of whether your SEO efforts are producing results, or if you need to focus on different strategies or better keywords.
Related: 13 Simple Ways to Make Search Engines Love Your Website
9. Average Inbound Links Per Blog Post
Inbound links are links to your blog from other websites. For example, another blog may highlight your content, or a social media post may call out a specific page or resource. These links are highly valuable, as they contribute to your domain authority and page authority.
While you can use Google Analytics to view information on “referrals” to see how many inbound links you have, there are other tools out there designed to explicitly track link data. For example, check out the Moz Link Explorer.
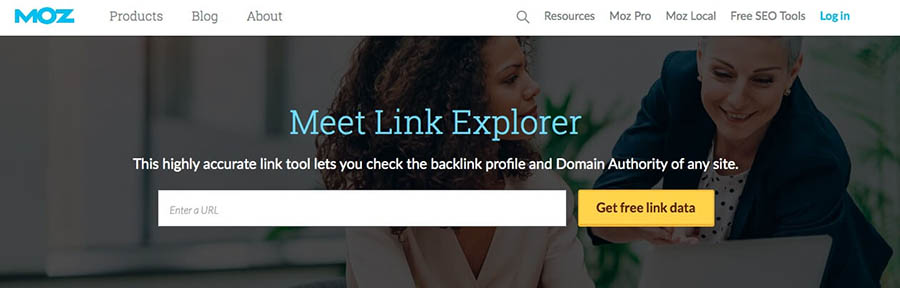
You can try this tool for free or as a part of Moz’s comprehensive SEO product offerings. Either way, understanding what posts attract the most inbound links can tell you more about what content on your blog is resonating with readers.
Engagement
Engagement can take many forms online. In a general sense, it’s any way readers interact with your blog (besides simply reading its content). Establishing what you consider to be valuable engagement is key — this may include clicks, comments, social shares, and so on.
10. Average Comments Per Blog Post
On many blogs, one of the most significant forms of engagement is comments. To track your comments, you can use a plugin like wpDiscuz.

This tool gives you full control over the comment experience on your blog. Not only can you track comments by user logins, but you can also implement a comment voting system. This can help to increase engagement if your numbers aren’t quite where you want them to be.
Get Content Delivered Straight to Your Inbox
Subscribe to our blog and receive great content just like this delivered straight to your inbox.
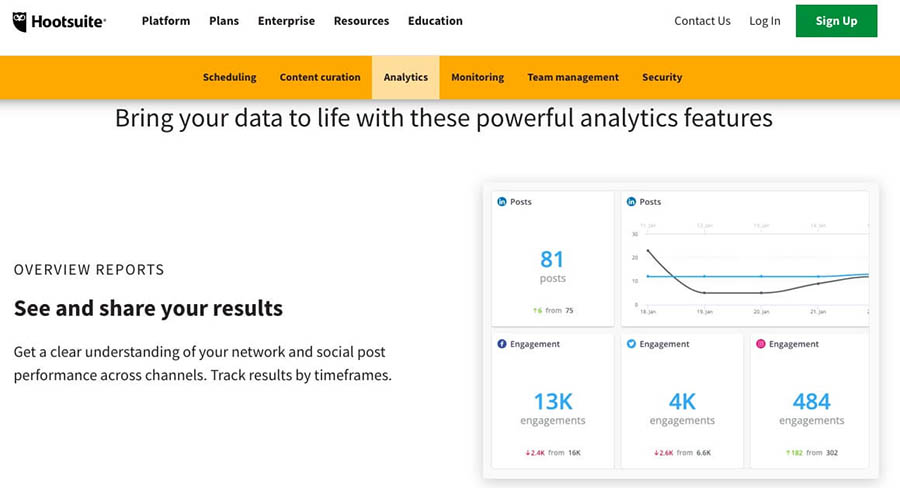
11. Social Shares Per Blog Post
Social media engagement is also crucial, although your target platforms and numbers will be specific to your individual marketing strategies. To get a true picture of this metric, you might want to look into a specialized tool such as Hootsuite. This enables you to track all of your social media engagement in one easy-to-use dashboard.
Since engagement online is not always linear, you might want to consider other kinds of tracking as well.
For example, the GetSocial.io plugin for WordPress has a paid service that tracks all social sharing from your website, including “Dark Social” shares. Those are harder data points to track because they take place through text messages or chat applications when content links are copied and pasted.
12. Clicks from Social Platforms
The referral links we discussed earlier are another way to measure user engagement. Through Google Analytics, you can see how many users are coming to your blog via your social media profiles and posts.
If you’re running a marketing campaign that’s heavy on social media, you’ll likely want this metric to show plenty of clicks from your social content. Weak or static numbers can be addressed through smarter social media promotion strategies.
Conversions
Conversions are often used to track sales, but a “conversion” can be any action you’d like to encourage on your blog. For example, you may measure sign-ups to an email list, or downloads of a free e-book. No matter what it represents, understanding your conversion rate helps you implement Conversion Rate Optimization (CRO), in order to make positive changes for your blog.
13. New Blog Leads and Customers
Using your blog to drive traffic and gain customers can be a crucial part of any content marketing strategy. To know how well you’re doing, however, you’ll need to track how many new leads are generated by your content.
One way to do this is to use trackable links throughout your blog, especially on Call-to-Action (CTA) buttons and links to related internal content. You can use Google Analytics and MonsterInsights for this, or create a more custom approach with a plugin like Pretty Links.

This tool enables you to create custom, shortened URLs that maintain your branding. It also provides valuable tracking of links on your site and other platforms, so you can see whether your blog is attracting a steady stream of new leads.
Related: How to Get Visitors to Fill Out Lead-Generation Forms on Your Website
14. Posts That Bring in the Most Leads and Customers
Once you establish a way to track the leads generated by your content, as explained above, you can aggregate and filter that data in your chosen analytics tool. This will help you determine which posts and pages are generating the most leads and/or customers.
Knowing what kind of content gets people to take action is key. Conversion-generating posts on your blog let you know what strategies are working, so you can replicate that success in future content.
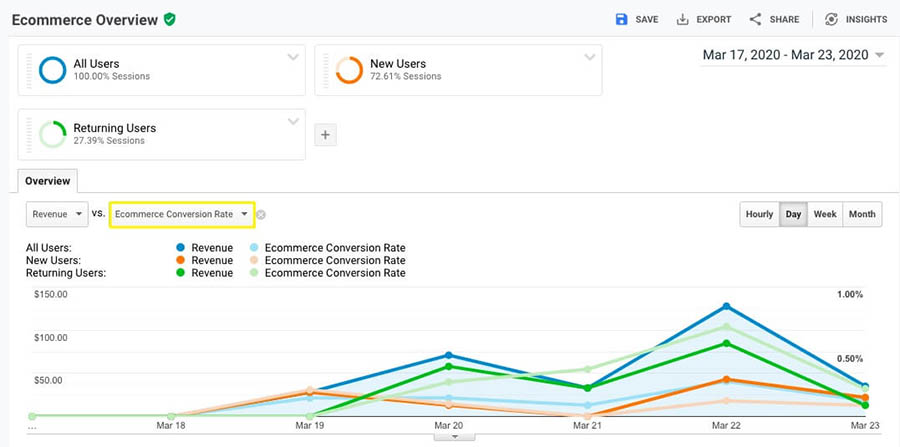
15. Conversion Rates
Your blog’s channels, post views, page views, leads, and so on are often tracked with a primary goal in mind — improving conversion rates. Google Analytics offers an abundance of options for customizing your views of different conversion rates, in comparison to other metrics.
However, the most basic way to determine your rate without a built-in tool is to divide the number of conversions you’re getting by the total number of site visitors in the same time frame. It’s essential to keep in mind that different industries have various benchmarks for what is considered a successful conversion rate.
16. Lead Source Breakdown
Your lead source breakdown primarily comes from the channel data we discussed earlier. It can include information from other sources as well, however, so using a full Customer Resource Management (CRM) system can be helpful.
The goal is to find out not only what sources or channels are leading readers to your blog, but which ones are ultimately generating the most conversions. If your social media posts attract a lot of visitors, but almost none of those visitors convert, it’s time to consider whether you’re focusing on the wrong audience or failing to answer their particular pain points.
Email Marketing
Email marketing remains one of the most successful approaches for online businesses and blogs. This means that communication by email as a marketing tool is a highly-recommended approach. Plus, it also provides a wealth of trackable data.
17. Total Email Subscribers
Creating an email newsletter for your blog is an excellent strategy for giving readers a way to engage and provides a useful metric to track. The most effective way to get the numbers you need is to leverage a tool like MailChimp, which can be easily integrated with WordPress websites.

The first and most basic metric to track is your number of subscribers. Obviously, the more subscribers you have, the better. Just as with page views, however, what you’re looking for isn’t an exact number so much as a slow-but-steady increase in subscribers over time.
Related: Build an Email List With Your WordPress Website in 3 Simple Steps
18. Email Open Rates
An email’s “open rate” represents how many recipients actually opened it in their inboxes. Mailchimp’s benchmarking data puts the average open rate between 15% and just over 28%, depending on your industry.
While there are many ways to encourage people to open your emails, one of your best options is to try a variety of strategies and keep an eye on the numbers to see which ones result in the most engagement. Just keep in mind that tracking open rates really does require email-specific tracking tools.
19. Email Click-Through Rates
Next up are your Click-Through Rates (CTRs). This represents how many people not only opened a given email but also clicked on one of the links it contained. This can include links back to your blog and social media platforms, as well as all kinds of direct CTAs.
The average benchmark for CTRs is 2.6% across all industries. Again, however, the specific metric you’re aiming for will depend on your audience, niche, and goals. A poor CTR on a given link may mean you need to spend some time developing stronger CTAs that appeal to your audience’s interests and needs.
Output
For the most part, your blog’s “output” can be quantified in terms of the number of posts you publish. For that reason, conducting a content audit can provide you with vital information to consider alongside the various metrics outlined in this article.
Related: Take Your Content Strategy Up a Level with a Content Audit
While there are a lot of great content audit tools on the market, we recommend Semrush, an SEO software suite that’s trusted by 5 million marketers around the world.
You can use its Content Audit feature to get an overview of your most important metrics: user behaviour metrics (number of sessions, session duration, and bounce rate), social impact (number of shares across major social networks) and websites linking to your content. Then turn to the Content Analyzer to see how different articles and authors compare. Based on the results, you’ll be able to determine which articles, authors, and topics get you the most traffic and which ones could use some work.
If this sounds like something you’re interested in, we’ve worked out a free trial with Semrush for our readers, so you can see if the tool is a good fit for your site without a long-term commitment!

20. Number of Blog Posts Published
Experts tend to advise new bloggers to view their content plan as a marathon, not a sprint. This means you don’t have to do it all in one day, and it can take a while to build up a meaningful collection of content.
With that being said, there are some things you can do to start collecting the data that will tell you whether your blog is making an impact. This includes sticking to a consistent publishing schedule, as well as keeping an eye on how much content your blog has in total.
Depending on your industry and topic, you’ll often start to see your audience grow when you amass between 75 and 215 blog posts. However, quality plays a significant role as well. So while the overall output is important, you shouldn’t prioritize this number over the quality of your blog posts.
Managing Your Blog’s Data So You Can Measure Your Success
All websites create a data trail. Investing in the resources to follow that trail can help you leverage all the blog metrics we’ve discussed. Not only can this data inform your marketing strategies, but it can also help you keep track of whether you’ve hit your goals.
It almost goes without saying that Google Analytics is one of the most accessible and budget-friendly options out there. Since it can be integrated with many other tools and plugins, and you’ll have some of the most critical metrics right at your fingertips, it’s worth setting up.
If you’re not happy with the numbers you’re seeing and you want to start fresh with a new web host, check out our shared hosting plans. We even offer a free website migration plugin, so you can move your blog without the hassle and start seeing better performance and engagement!