PageSpeed Insights Deep Dive (Full Walkthrough & Tips for Scoring 100)
On the Internet, there is no speed limit – but thankfully, there is a speedometer.
Your website’s speed and performance has a major impact on business. It can improve your search rankings and SEO, increase website engagement, and drive more conversions – and revenue.
But before you can optimize your website’s speed, you need to know how it performs.
That’s where PageSpeed Insights comes in.
This free tool from Google helps you understand your website’s performance, but it can be complicated to jump into.
After all, what do all of these different terms and scores mean? How are you supposed to know what to do or where to start?
This guide is focused on what to do with the results of your PageSpeed Insights report and how to strategically work through specific solutions to improve each of your scores, no matter what issues need to be addressed!
Today, we’ll walk through each of the key factors and show strategies for improving your performance with each one.
What is Google PageSpeed Insights?
PageSpeed Insights is a tool that tests, measures, and reports on your website’s performance. It captures vital data about how users experience and engage with your site by analyzing things like site speed, load time, and user experience.
In addition to scoring your website on a stable of key performance metrics, PageSpeed Insights runs a range of diagnostics and also recommends specific action items to help you improve your website’s performance.
PageSpeed Insights is powered by Google’s open-source analysis engine, Lighthouse.
What makes PageSpeed Insights particularly important for webmasters and marketers is that site performance is intricately linked to user experience (UX), SEO, traffic, conversions, and all of the other KPIs that matter most to the business.
Website Performance
A website’s performance refers to the speed and uptime of the site. A better-performing site will have faster load times, run more smoothly, and have little to no downtime.
Read MoreGetting 100% on PageSpeed Insights is sort of like acing your SAT.
It doesn’t necessarily mean you’ll do great in college, but it definitely gives you a leg up.
Page Speed and SEO
Let’s answer the main question first.
Yes, your website’s speed and performance can impact search engine optimization (SEO).
In particular, poor performance can hurt your SEO. It’s helpful to think of your PageSpeed Insights as a “governor” for your website. If your scores are low, it means the website is slow – which also slows down your growth in the SERPs (Search Engine Results Page)!
Google has stated publicly that they use website speed signals, which they call “page experience,” as an SEO ranking factor.
There are three central factors included in the search algorithm that Google refers to as Core Web Vitals:
- Loading – Largest Contentful Paint (LCP)
- Interactivity – First Input Delay (FID)
- Visual Stability – Cumulative Layout Shift (CLS)
What are Core Web Vitals?
Core Web Vitals (CWV) was developed by Google and represents a trio of user experience metrics designed to help create a faster, more accessible, and higher quality web browsing experience. The three Core Web Vitals metrics include Largest Contentful Paint (LCP), First Input Delay (FID), and Cumulative Layout Shift (CLS).
Read MoreAll of these factors measure how quickly your website loads and the speed and quality of the user experience, which can also impact accessibility.
These three factors are part of the six total metrics measured by PageSpeed Insights.
How PageSpeed Insights Works
Now that we understand the who, what, where, and why….all that’s left is the how.
How does PageSpeedInsights work, and how do you use the information it provides?
First, a bit about how the tool functions behind the scenes, from Google directly:
“PageSpeed Insights provides both lab and field data about a page. Lab data is useful for debugging issues, as it is collected in a controlled environment. However, it may not capture real-world bottlenecks. Field data is useful for capturing true, real-world user experience – but has a more limited set of metrics.”
In other words, PageSpeed Insights is looking at two things.
First, Google’s computers load your website to see how it performs.
Second, since Google’s computers aren’t the same as a laptop you might use at home or work, they look at a log of historical data from real-world users who have visited your site in the last 28 days. (This data comes from the Chrome User Experience Report, often called “CrUX,” and it’s collected from users who use the Chrome browser.)
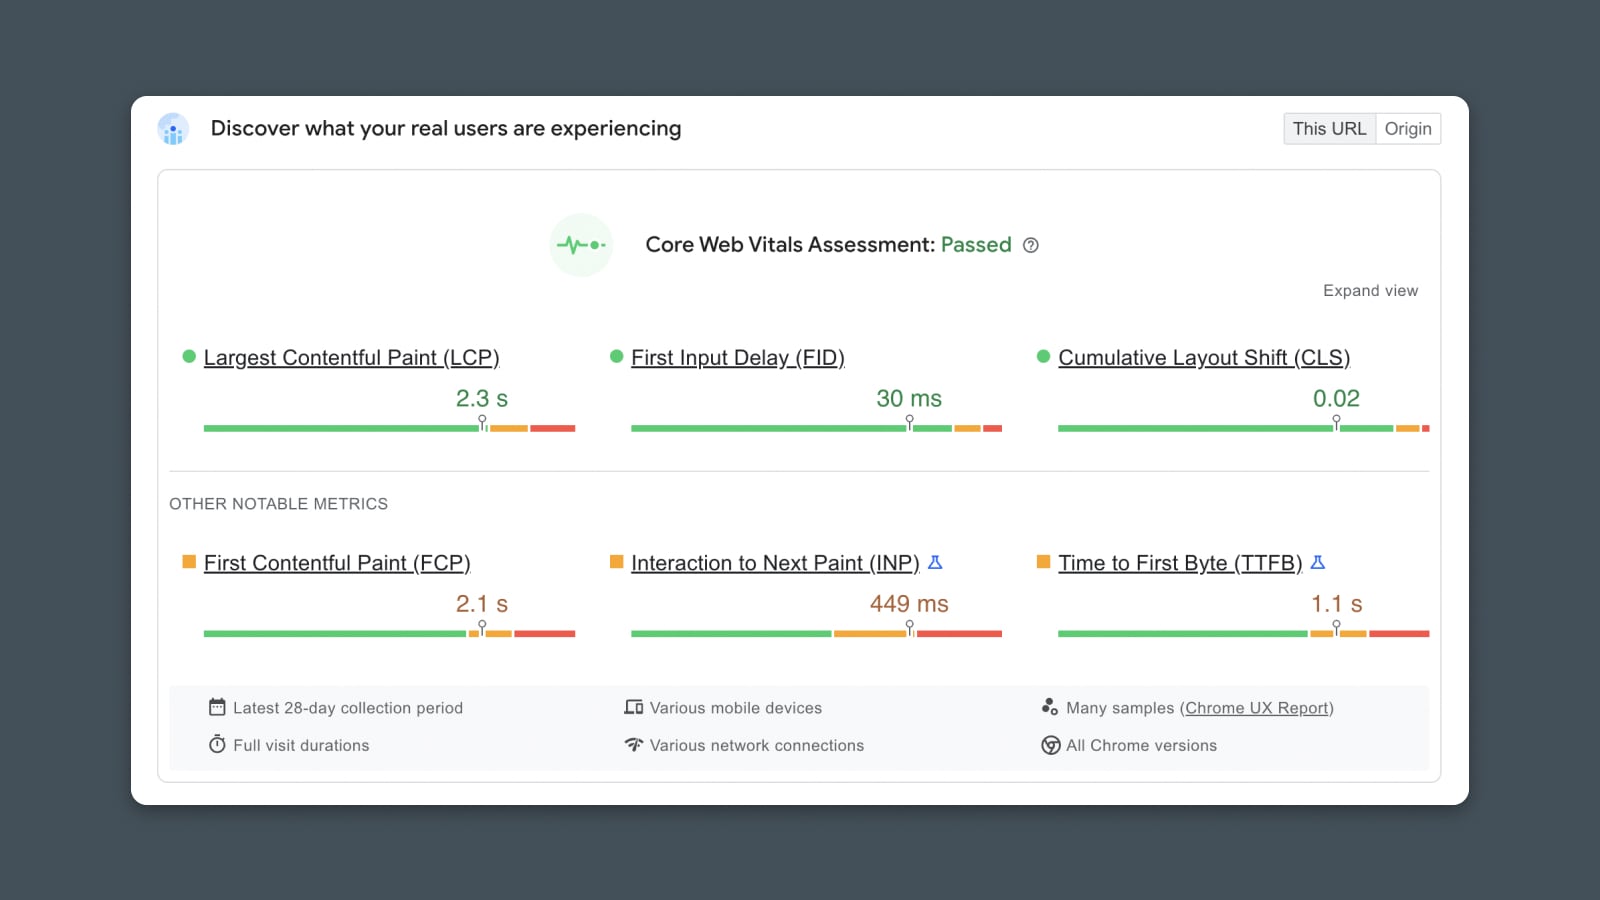
Then PageSpeed Insights combines these two tests and scores your website based on how real users might experience it.
The PageSpeed Insights Score is a collection of metrics about your site’s performance that breaks down which areas are good and which may need work.
There are 6 scores to know:
- First Contentful Paint (FCP)
- First Input Delay (FID)
- Largest Contentful Paint (LCP)
- Cumulative Layout Shift (CLS)
- Interaction to Next Paint (INP)
- Time to First Byte (TTFB)
Each of these metrics is measured and then scored according to the level of performance.
When you run a PageSpeed Insights report on your site, you’ll receive a score and a “grade” for each of these, which will fall into one of three buckets:
- Good
- Needs Improvement
- Poor
These grades are determined by predefined ranges that Google sets:
| Good | Needs Improvement | Poor | |
| FCP | [0, 1800ms] | (1800ms, 3000ms] | over 3000ms |
| FID | [0, 100ms] | (100ms, 300ms] | over 300ms |
| LCP | [0, 2500ms] | (2500ms, 4000ms] | over 4000ms |
| CLS | [0, 0.1] | (0.1, 0.25] | over 0.25 |
| INP (experimental) | [0, 200ms] | (200ms, 500ms] | over 500ms |
| TTFB (experimental) | [0, 800ms] | (800ms, 1800ms] | over 1800ms |
How to Use This Guide to Improve Your PageSpeed Insights Score
Understanding PageSpeed Insights is the first part of the battle.
Next, we have to figure out how to translate all the scores, numbers, and suggestions into an actionable plan for improvement.
Here’s how to use this guide:
- Run your website PageSpeed Insights report.
- Look for failed CWV tests or metrics in the “Poor” end of the scale.
- Find the section below that relates to those specific metrics.
- Work the steps (presented in order from highest to lowest impact).
- Re-run the PageSpeed Insights report.
- If necessary, repeat the process for any metrics still marked “Poor.”
- Move to the metrics marked as “Needs Improvement.”
- Repeat from the beginning.
Get Content Delivered Straight to Your Inbox
Subscribe to our blog and receive great content just like this delivered straight to your inbox.
#1 – First Contentful Paint (FCP)
Let’s dive into the first metric on Google’s list.
It’s the First Contentful Paint, or FCP, and it measures how quickly the user can see your website as it’s loading.
What is First Contentful Paint?
First Contentful Paint (FCP) is the time it takes for the first object to load in a user’s browser. This is different from the page load speed or load time because it’s not the time for the entire page to render — It’s just the first piece of the page to appear on the screen.
This is important from a user’s perspective because they can see progress as the page begins to appear.
It also means the strategies for speeding up FCP are unique from just making the whole page load faster.
FCP is measured in seconds.
- Good: < 1.8 seconds
- Needs improvement: 1.8 – 3 seconds
- Poor: > 3 seconds
Techniques to Improve FCP
Let’s say you scored 2.2s on your FCP score. You’re hoping to knock it down to 1.8s.
What tools are at your disposal?
Minimizing Render-Blocking Resources
Remember, First Contentful Paint isn’t just about how long the whole page takes to load. It’s about getting the first pixels to appear on the screen as quickly as possible.
One key strategy is simply changing the order of content on your page.
Let the browser render the most important text, images, and styles before it starts loading heavy scripts, fancy animations, and content that’s “below the fold.”
The first thing you should do: Delete any unused styles or scripts from your page.
If you’re loading JavaScript or CSS onto the page (usually in the Head section of the website), this will slow down the FCP. If you’re not using them, then it’s just slowing you down for nothing.
JavaScript
JavaScript is a programming language that enables you to create things within a web page or on a web server. When you view a web page, the JavaScript code will execute automatically.
Read MoreIn WordPress, you can usually accomplish this by disabling unused plugins, which may load code onto the page even if the plugin isn’t being used or displayed.
If you look at the findings in your PageSpeed Insights report, it will flag code that’s loaded into the page but not being used:
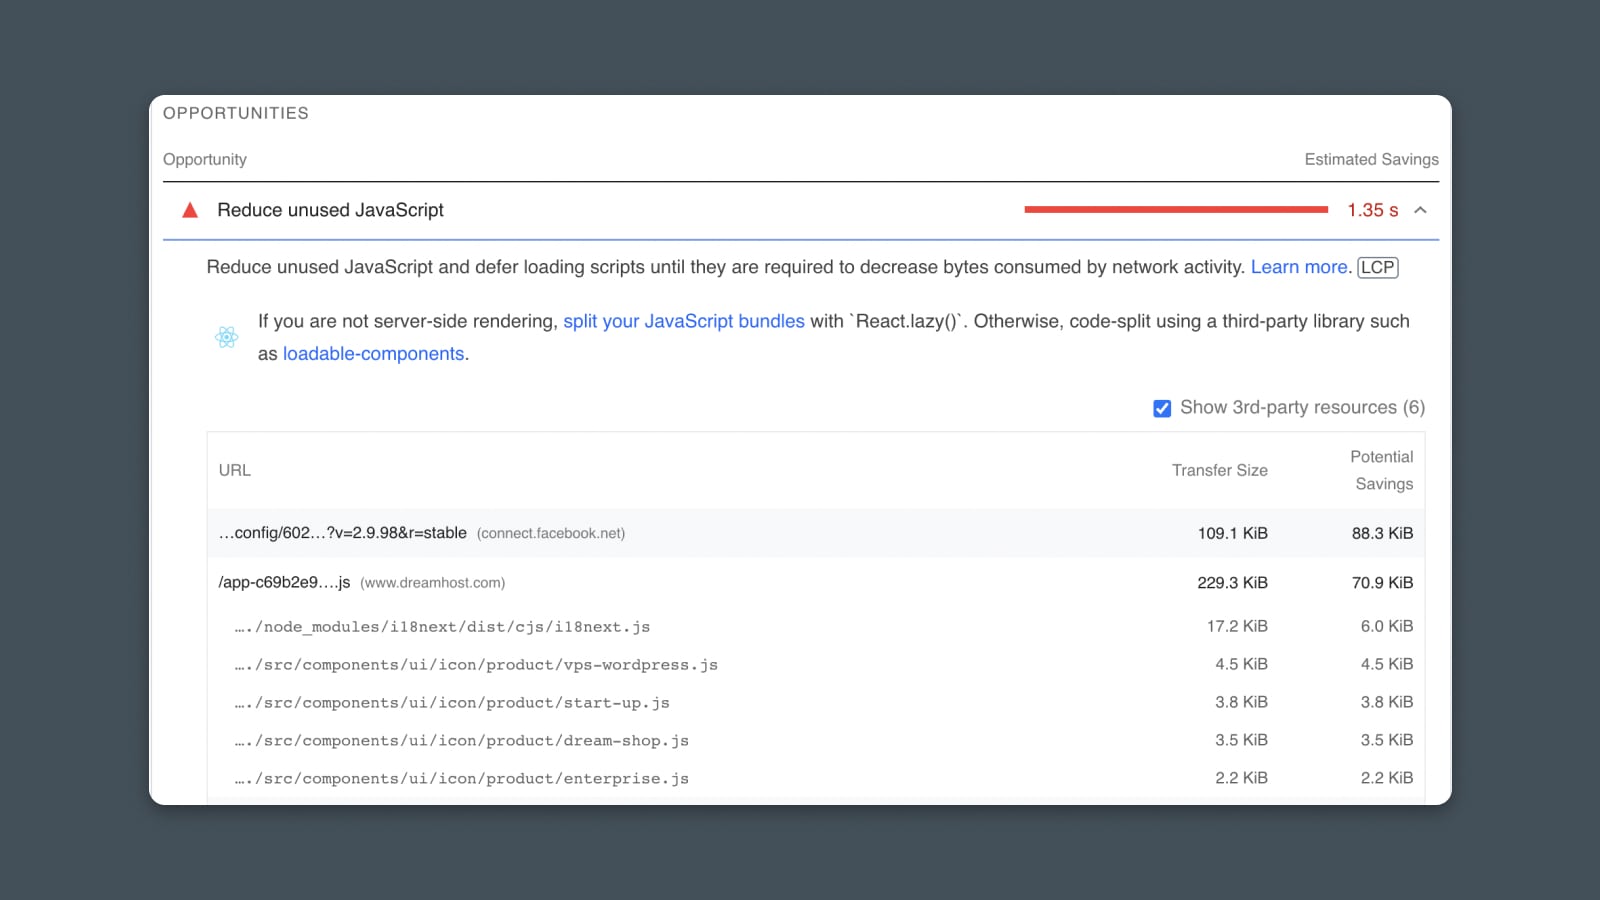
This should tell you which code or plugins you might safely remove.
(Note: Just because code isn’t used on one page doesn’t mean it’s not on other pages of your website! Be careful before you start hacking and slashing things from your pages.)
Next: Defer or load scripts asynchronously.
If you need scripts or styling on your page, but they aren’t immediately vital to the first content the user sees, then you can do what’s called defer or load them asynchronously. This tells the browser to wait to load them rather than loading them in the order they appear on the page.
This is pretty simple — You can add a bit of extra code to your website that will instruct the browser to either defer or load async (or both):
<script src="app.js" async></script>
(Nerd Note: Async and defer are not technically the same thing. But, for most of us, the difference is mostly semantics. Nevertheless, feel free to go down the rabbit hole and find out more about the subtle nuances.)
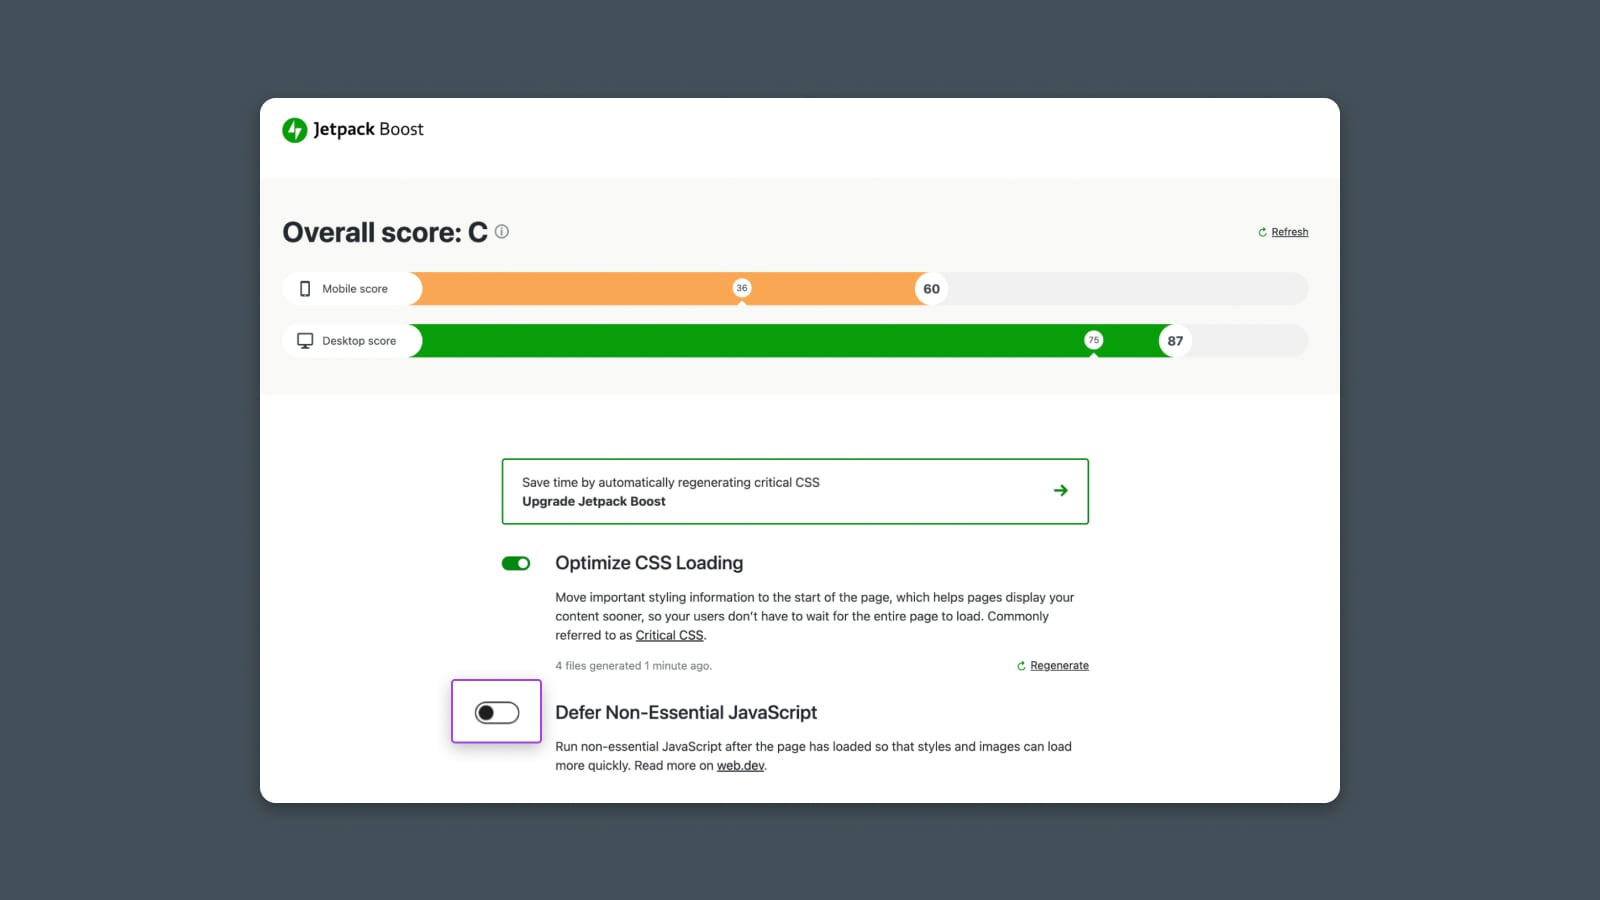
If you want an easier way to handle this step, consider using the JetPack Boost plugin for WordPress.
JetPack is a free plugin suite that gives you all kinds of tools to optimize the speed and performance of your website. Notably, you can choose to defer loading non-essential JavaScript with a simple click.
From inside WordPress, go to Plugins > Add New.
Then, search for Boost. Click “Install” and “Activate”.
You should see a new menu in your left-hand navigation called “JetPack”.
Go to JetPack > Boost.
The plugin will render your site in the background and show your score, plus options for improvement. To defer non-essential JS, simply click the toggle to enable it.
Finally: Restructure CSS (styling).
If you’re familiar with CSS, you’ll know that it’s common to throw all your styles into one big blob of code and load it all in a standard file like style.css.
It’s not wrong. It’s just not very performant.
To improve FCP, you can optimize your CSS structure:
- Remove all of the styles that apply to content that’s part of the FCP (anything “above the fold.”)
- Add these styles as an inline style block in the header of your website.
- Load the remaining styles asynchronously with a “preload” function (shown below.)
<link rel="preload" href="styles.css" as="style" onload="this.onload=null;this.rel='stylesheet'">
<noscript><link rel="stylesheet" href="styles.css"></noscript>
Alternatively, if you have a lot of separate styles for different devices and browsers, you may want to split your stylesheet into multiple files and use a media query @import to only load the appropriate styles.
Optimizing Images and Videos
Since FCP is mostly about optimizing for the first few hundred pixels at the top of the page, we won’t go into too much detail on optimization for images and videos here.
But if your header has a lot of images or you have a video at the top of the page, then it may be worth investigating how to optimize these assets to improve initial load speed. See below for more details on how to approach optimizing.
Using a Content Delivery Network (CDN)
Same as above. CDNs can help load your whole page faster, which gives a small boost to FCP. See below for more details on using a CDN.
#2 – First Input Delay (FID), Total Blocking Time (TBT), and Time to Interactive (TTI)
Now let’s talk about tradeoffs.
If you only paid attention to First Contentful Paint, you may think that all you need to do to crush your PageSpeed Insights score is defer and load all of your resources later to make that top portion of your website load quickly.
But if the website appears to load quickly, yet I can’t actually interact with it, then that’s also a poor user experience.
Enter: First Input Delay.
First Input Delay is also related to Total Blocking Time (TBT) and Time to Interactive (TTI) metrics.
Let’s unpack each of these and how they’re related but different.
What is First Input Delay?
First Input Delay (FID) is the time it takes for the browser to respond to a user’s first input or interaction (e.g., clicking a link or button). Your website’s performance impacts the delay because most interactions can’t be processed while the browser is loading or rendering code.
In other words, if your code takes a long time to finish loading, it will prevent the user from interacting with the website, and there will be a delay or lag time between when they click to when the action takes place.
This metric is measured in milliseconds, and based on real-world user data.
- Good: < 100ms
- Need Improvement: 100 – 300ms
- Poor: > 300ms
What is Time to Interactive (TTI)?
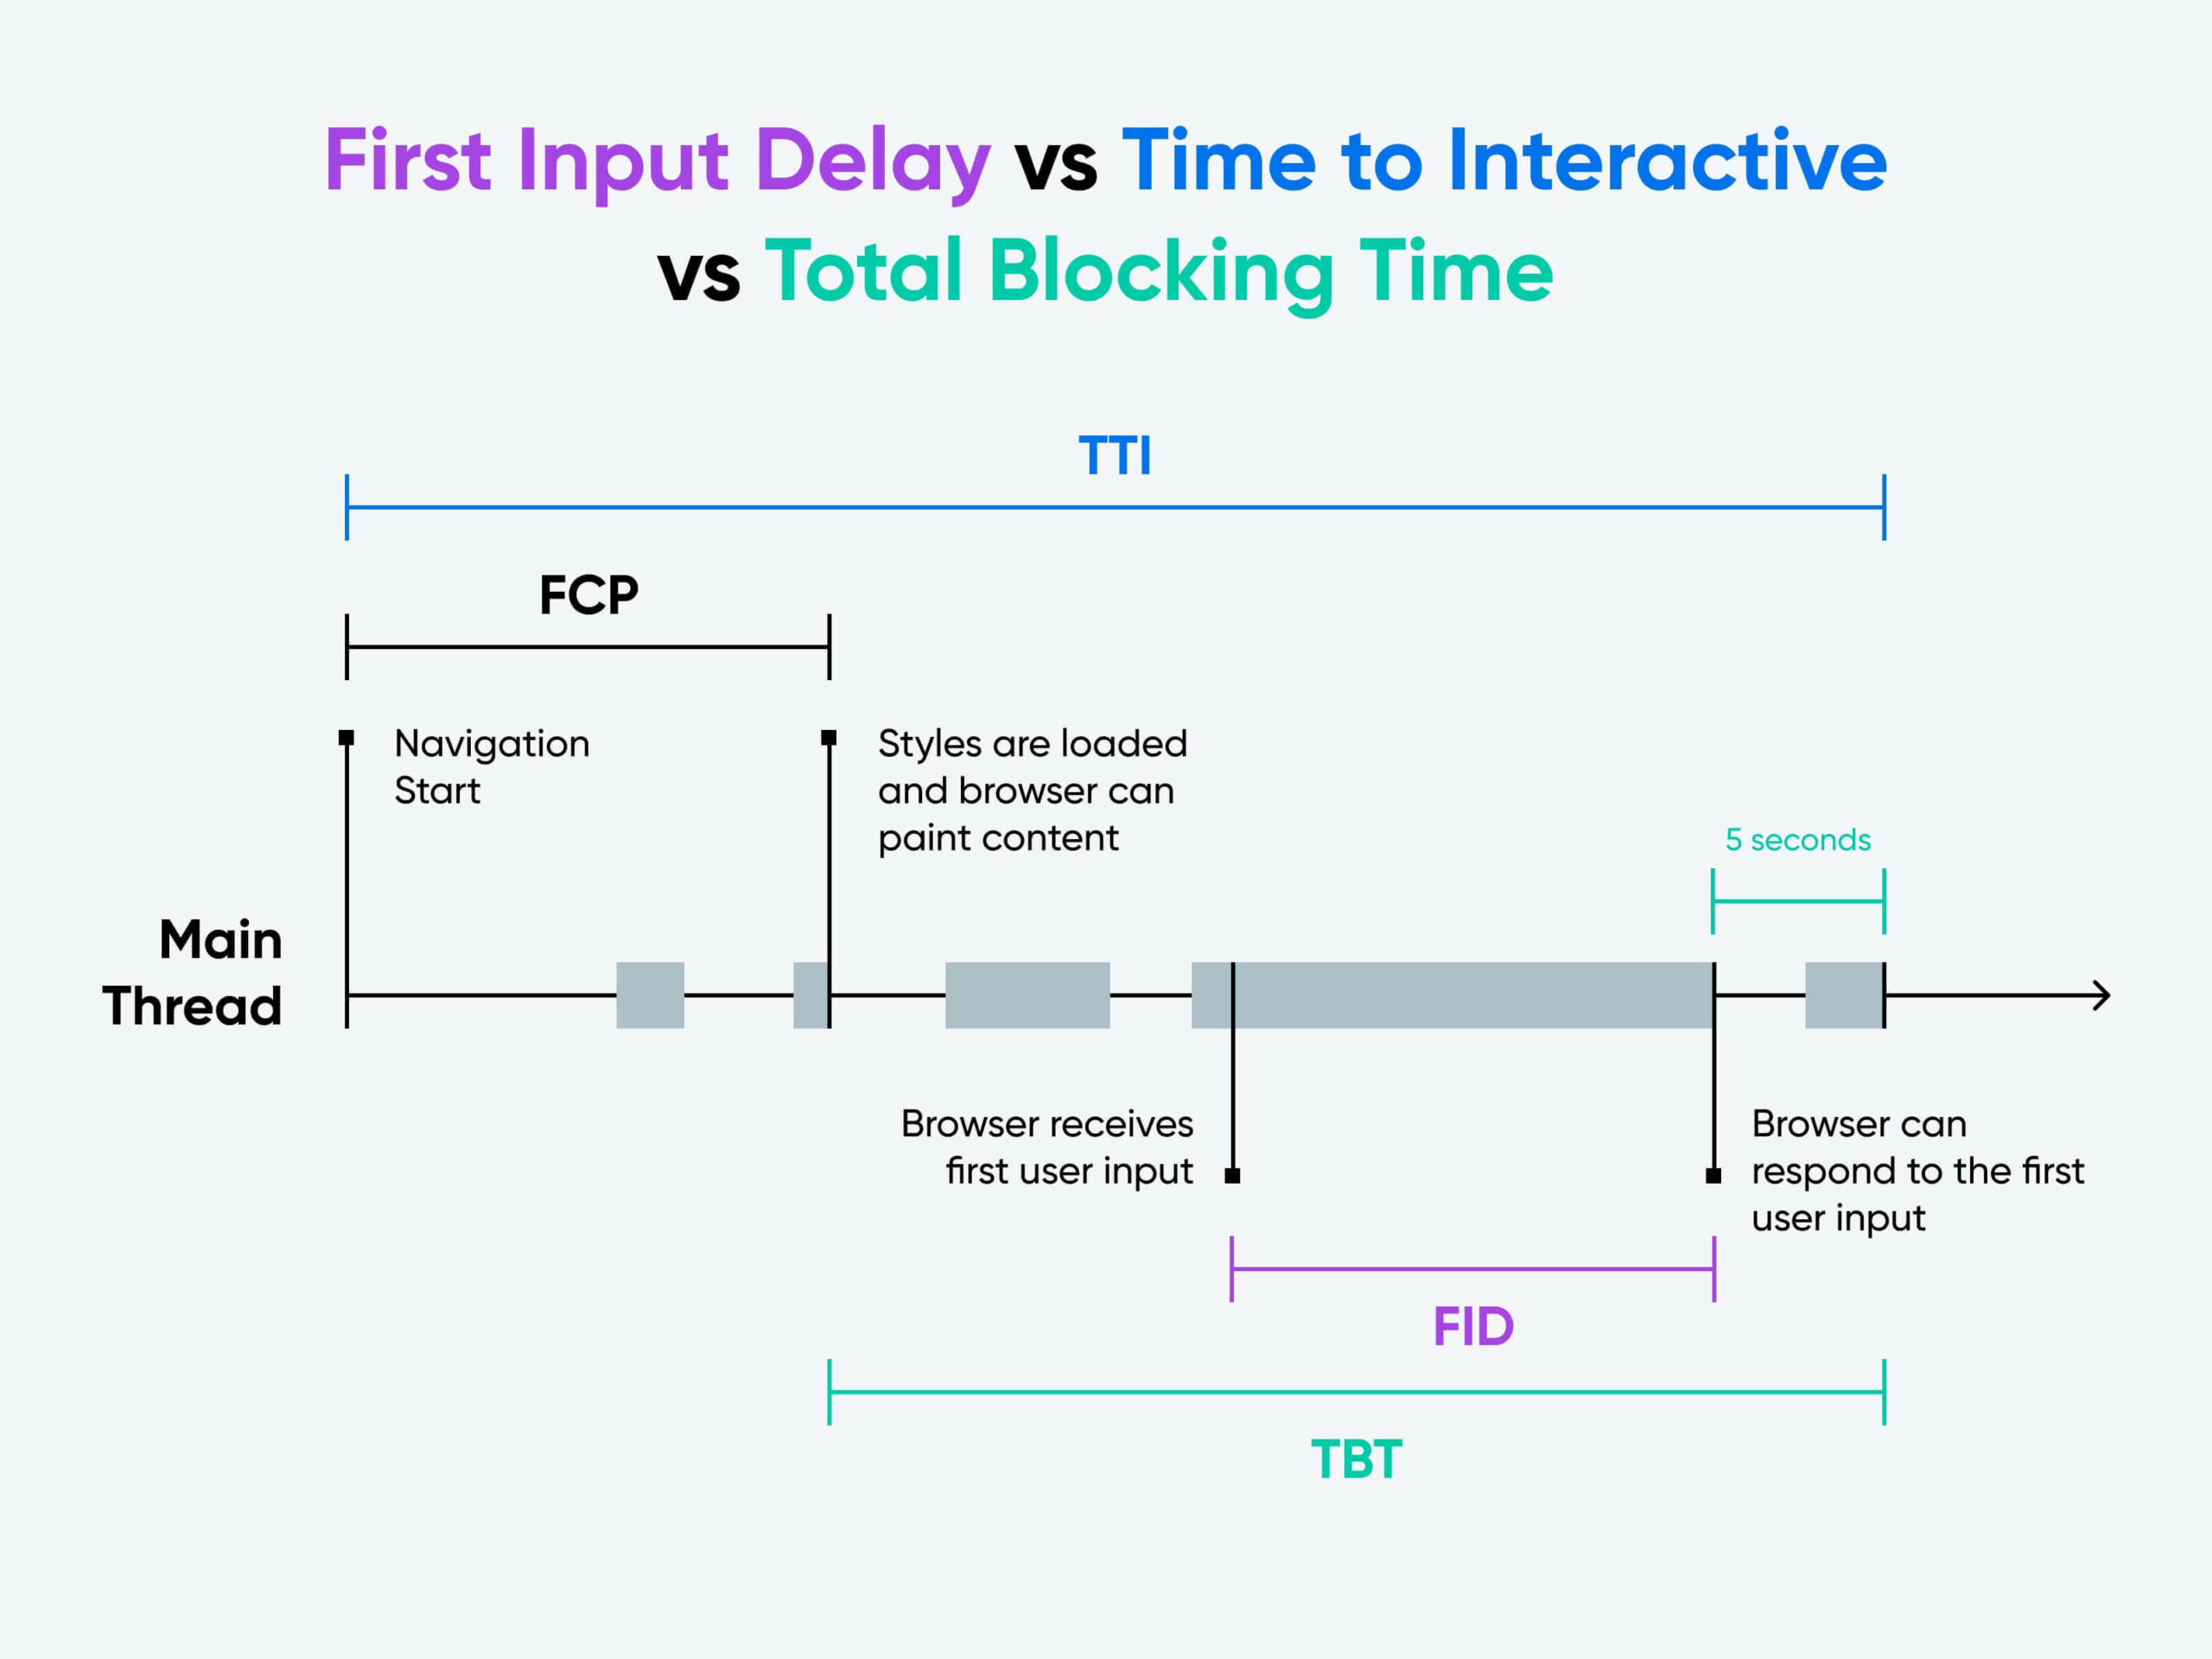
Time to Interactive is the time it takes for the page to become “reliably interactive.”
Google defines “reliably interactive” as when the browser’s main thread is free for at least 5 seconds, making the page fully interactive to the user.
This is a metric measured by Google’s Lighthouse, so it’s not based on actual user data. Instead, it’s measured under specific, controlled criteria.
What is Total Blocking Time (TBT)?
Total Blocking Time measures the full period of time between FCP and TTI.
In other words, the clock doesn’t start running until the top of the page is rendered, and then it stops after the page is considered “reliably interactive” or 5 seconds after the main thread is free.
First Input Delay vs Time to Interactive vs Total Blocking Time
These three metrics are related but not identical.
First Input Delay is based on real-world user data and Core Web Vitals. TTI and TBT are measured by the performance report in PageSpeed Insights, powered by Google’s Lighthouse.
In terms of improving the performance of these three metrics, the solutions are also similar but not identical. Most notably, solutions for improving FID that involve deferring JavaScript rendering won’t improve TTI or TBT because JavaScript still needs to be loaded.
But solutions like removing, minifying, and caching should help improve all three metrics.
Techniques to Improve FID, TTI, and TBT
By far, the most significant impact on FID is the JavaScript loaded on your page.
You can think of JavaScript like a separate train track for the browser. While it’s rendering or executing JavaScript code, it can’t complete other tasks or respond to inputs like a user clicking a link (the “main thread” needs to be free for the browser to respond).
So the longer it spends reading and executing the JavaScript when the page first loads, the longer the delay will be if the user begins interacting with the page.
Reduce the Impact of Third-Party Code
One usual suspect for slow input response is that the website is still loading in all kinds of third-party tools, widgets, and apps to your website.
Every time you add things like Facebook, Drift, Intercom, HotJar, or other third-party tools and services to your website, it adds a bit of code that will need to be loaded and rendered on the page.
If you have a lot of these services, it can take a long time to load them all.
Worse yet, you don’t have any control over how quickly these resources are loaded on your site. So if the browser is trying to fetch some JavaScript from a third-party website on a slow server, it could cause significant delays.
Let’s fix it.
Option #1: Delete all unused third-party tools.
Chances are that you’ve installed all kinds of services, plugins, and tools on your website over the years. And you probably only use a few of them.
Now’s the time to delete or uninstall the ones you aren’t actively using.
To get a full list of the third-party JavaScript loading on your page, refer to your PageSpeed Insights report or run a separate Lighthouse report.
You should see a list of all of the scripts being loaded and how long they take:
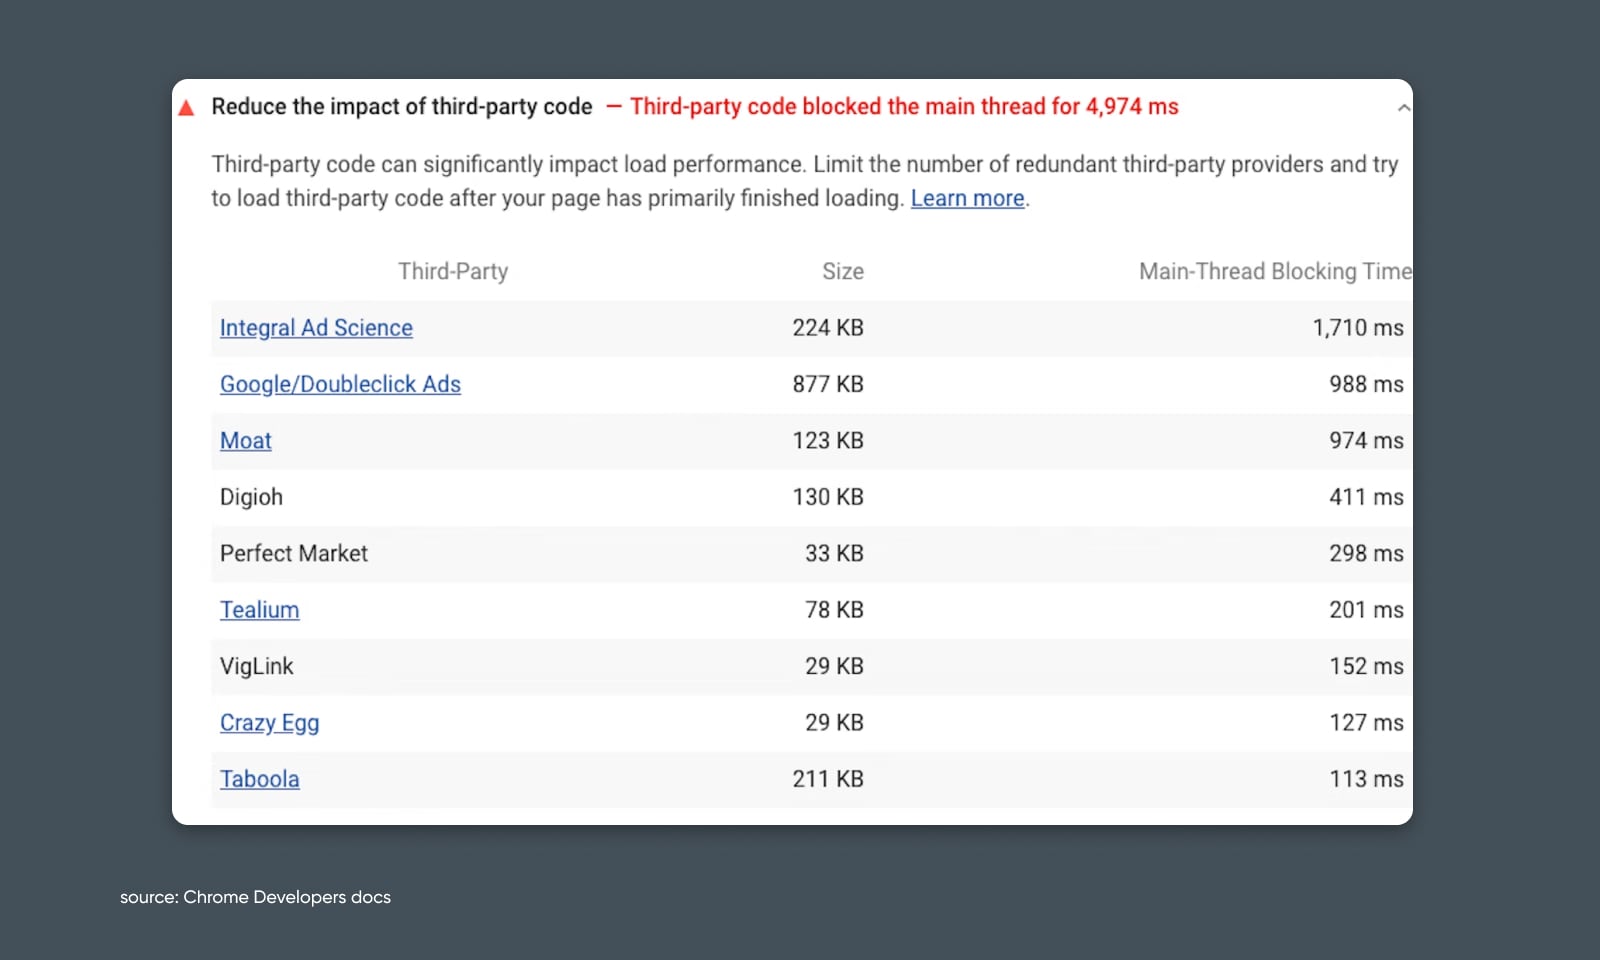
Now, using this information, you can decide which of these are critical and which can safely be removed.
Depending on which services you want to delete, you may need to manually remove the code from your website, uninstall a WordPress plugin, or remove code that’s added via Google Tag Manager to improve page performance.
Option #2: Load JavaScript async.
Unless it’s vital to rendering the FCP, it’s almost always advisable to render third–party scripts asynchronously. If you have vital JavaScript that’s slowing down FID but you can’t remove it, then try having it load async instead.
Minimizing JavaScript Execution Time
Third-party code can be a scoundrel, but what about our very own code that we’ve put on our website?
Chances are it’s not innocent in the slow load time.
If you have non-essential JavaScript that you’ve added to your own website, you may want to remove it.
Looking at the PageSpeed Insights report, you should see a section that references unused JavaScript:
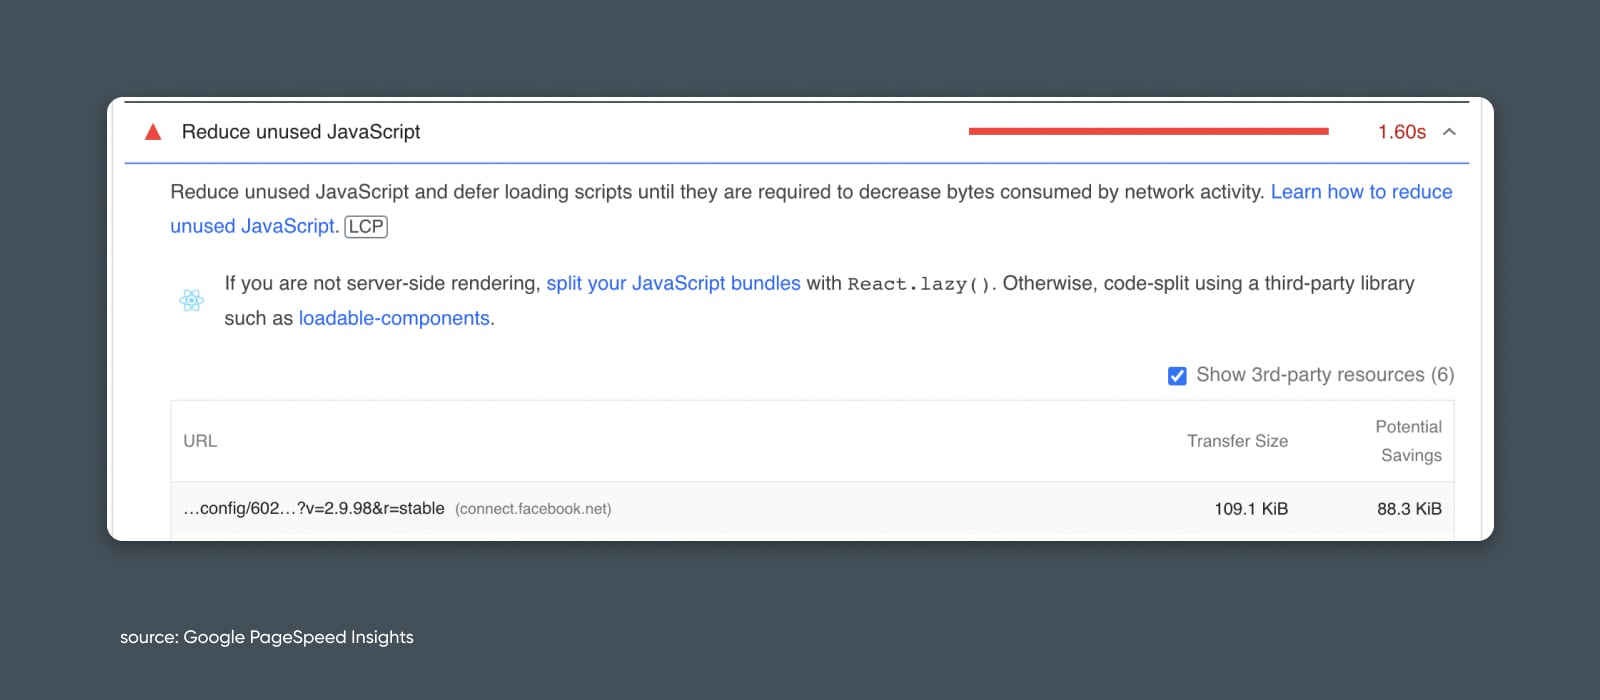
- If the JavaScript is 100% unused, consider deleting it
- If the JavaScript is used on other pages, consider only delivering it selectively on the pages where it’s necessary (also known as “code splitting”)
You can also explore options for improving the JavaScript’s load time.
The most common way to speed up load time is to reduce file size. And with JavaScript, there are two main strategies:
- Minification – Removing all of the spaces, line breaks, etc. in the code
- Compression – “Zipping” the file to make it smaller
Either of these could help make your code more performant.
Prioritizing Visible Content
If you’re primarily concerned about improving FID, then you may want to focus on deferring JavaScript and other page elements to only focus on content within the first contentful paint.
After all, users cannot interact with elements that haven’t been rendered.
#3 – Largest Contentful Paint (LCP)
If FCP is your car’s 0 to 60 time, then LCP is its quarter-mile.
Okay, for the non-gearheads, what I mean is that LCP measures how quickly the user can see the “main” content on your web page.
What is Largest Contentful Paint?
Largest Contentful Paint (LCP) is a metric that measures how long it takes for the largest block of content on a page to be visible to the user. Unlike FCP, it looks at the load time for the largest block of image or text on the page regardless of its position or order.
It measures the largest block of content based on its dimensions within the user’s viewport. In other words, if there is a single <div> with lots of text or a single image that takes up a large portion of the screen, that may be considered the largest block of content and used to calculate LCP.
It’s measured in seconds and based on real-world user data (or “in the field”):
- Good: < 2.5s
- Needs Improvement: 2.5 – 4s
- Poor: > 4s
Techniques to Improve LCP
Before you begin working to optimize your LCP, you may want to determine which part of your page is considered the largest block of content.
This may help you target your efforts to improve performance on a specific page or template.
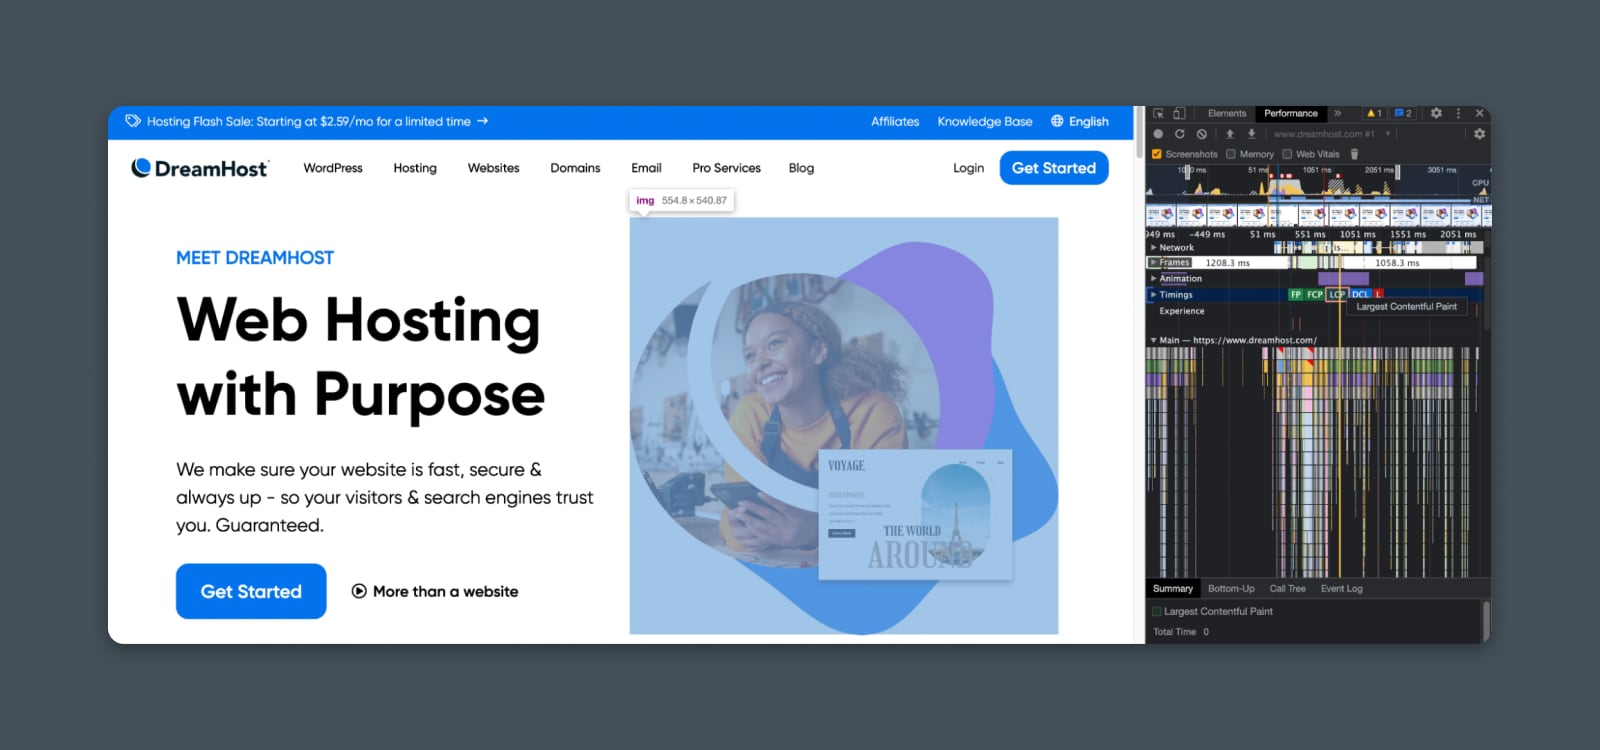
You can do this by using Chrome DevTools in your browser to identify the LCP resource on any specific page.
Optimize Loading Priority
In the above sections, we’ve discussed options such as using async or deferral strategies to accelerate rendering key parts of the page.
You may want to consider those here as a first-line option.
Removing or deferring render-blocking resources can help the main content load more quickly. But keep in mind that if these resources significantly change the layout or structure of the page, it could actually change which block is considered the largest and slow down LCP rather than improve it!
You can take this strategy one step further. Especially if the largest block of content is an image.
You can apply what is known as a PRPL (Preload, Render, Precache, Lazy load) framework to target specific resources on your page and to load first in the queue. If that image is the largest content block, then it will dramatically improve your LCP score.
Lazy Loading
Lazy loading is a design pattern used in software development to improve performance and reduce resource consumption. It involves postponing the initialization or loading of an object until it is needed.
Read MoreIn addition to async rendering options, this framework provides other strategies for optimizing the rendering path.
One of the simplest is preloading critical assets.
You can do this by simply adding a small snippet to your website’s header that tells the browser to prioritize critical images, fonts, styles, or scripts, which may be critical to your largest content section.
For instance, if you have a hero image that is the largest block on the page, then you might want to pre-load that image on each page using a snippet like this:
<link rel="preload" as="image" href="image1.png">
This tells the browser to start loading this resource right away, before it’s discovered on the page.
Optimize File (Resource) Size
Now let’s talk about file size.
Bigger files take longer to load. This applies to images, scripts, videos, fonts, and anything else on your page that may be loaded as part of the largest content block.
One way to speed up your LCP score is file size optimization.
Strategies for optimizing file size will depend on the format of the file.
Optimizing Images
Commonly, you’ll find big gains by compressing and optimizing your images.
Start by evaluating these areas for improvement:
- Format: Different image formats offer varying levels of compression and quality. For most web use cases, JPEG, PNG, and WebP are the most common formats.
- JPEG is usually best for photos.
- PNG is usually best for designed images with text or sharp edges.
- WebP is a more efficient format that provides better compression without sacrificing quality, but it may not be supported by all browsers.
- Compression: In many cases, you can compress an image’s file size without losing much or any visual quality.
- Online image compression tools: TinyPNG (for PNG and JPEG), Squoosh (for WebP).
- WordPress image compression tools: ShortPixel, Imagify.
- Image size: If you’re uploading raw images or photos to your website and then adding them to your page, chances are they’re way bigger than they need to be, slowing down the load time.
- Re-size your images and upload only the size you need.
- Use a WordPress plugin to automatically resize images when they’re uploaded.
- Use the “srcset” and “sizes” attributes in the “img” tag to specify multiple image sources and sizes. The browser automatically chooses the most appropriate image based on the user’s screen size and resolution.
Optimizing Scripts and Styles
Any resources necessary to render the largest content block will need to be fully loaded before LCP is calculated.
This includes scripts and styles that impact your largest content block.
Using some of the techniques we’ve discussed before, you can improve LCP by optimizing the file size and render path for JavaScript, CSS, etc.:
- Minify the files.
- Code splitting to reduce file size.
- Add styles and scripts in-line.
- Pre-load or cache.
Optimizing Videos
If your LCP resource might be a video, then you should consider ways to optimize videos.
- Host the video on YouTube or another service with a fast CDN rather than uploading directly.
- Compress the video file size.
Optimizing Fonts
If the LCP resource in question is text and that text uses an imported font (e.g., from Google Fonts), then you can optimize by improving the load speed of the font file.
- Only use WOFF and WOFF2.0 file fonts for the web.
- Pre-load the font file using a link rel tag (see above).
- Explore more options for further reducing font file size load time.
Implement a CDN
Think of a CDN like an HOV lane on the highway.
It helps the browser download resources more quickly by caching them in servers worldwide.
CDN
CDN is an abbreviation for “Content Delivery Network”. It refers to a geographically-distributed network of web servers (and their data centers). The entities that make up a CDN collaborate to ensure speedy content delivery via the internet.
Read MoreThe main thing to know is this: Implementing a CDN can dramatically improve website performance across the board. And, especially when it comes to LCP, it can help render images, scripts, and other assets faster than your web host’s normal server.
To implement a CDN:
- Select a CDN provider: There are several popular CDN providers available in the market, such as Cloudflare, Amazon CloudFront, Google Cloud CDN, and Fastly.
- Set up an account and configure the CDN: Once you have selected a CDN provider, sign up for an account and configure the CDN settings. This typically involves creating a CDN zone, configuring caching rules, and setting up SSL/TLS encryption.
- Integrate the CDN with your website: To integrate the CDN with your website, you will need to update the URLs of the content you want to serve through the CDN. This involves changing the nameservers to point to the CDN instead of your normal server.
- Test the CDN: After integrating the CDN with your website, run tests to ensure that the content is being served through the CDN and that the LCP performance has improved.
For a more detailed guide, check out our article on using a CDN with WordPress.
Improve Server Performance
Last, but certainly not least, your web host’s server performance also plays a key role in LCP.
We’ll cover this fully when we dive into TTFB; suffice it to say that the browser can only download resources as quickly as the server allows. If it takes a long time for the server to respond, it will take a long time for the resource to load.
#4 – Cumulative Layout Shift (CLS)
Did you know websites can dance?
Well, sort of. And not very well.
More accurately, they can shift. The elements on the page move around while different images, scripts, styles, and text get rendered until the page is fully loaded.
What is Cumulative Layout Shift?
Cumulative layout shift measures how far the images, text, buttons, and other elements on your page move on the screen while the user is waiting for the page to load. Lower CLS is considered better for the user experience.
That’s not really surprising if you consider your own browsing habits.
If you feel like you’re playing whack-a-mole while trying to click a link that keeps moving further down the page, you’ll probably get frustrated and leave the site altogether. (Hello, bounce rate!)
This experience can be especially infuriating while browsing on a mobile device.
CLS is field data from real users, and it’s measured as a score that combines the “impact fraction” (what percentage of elements in the viewport shifted) and “distance fraction” (how far did they move relative to the total size of the screen).
There is also a special designation for “expected shifts” (e.g., clicking a button that opens up a new section on the page) and “unexpected shifts,” which aren’t prompted by user input.
CLS is measured by multiplying the impact fraction and distance fraction:
- Good: < 0.1
- Needs Improvement: 0.1 – 0.25
- Poor: > 0.25
Techniques to Improve CLS
Chances are that if you’re not intentionally trying to trick your users by moving things around on your page, your CLS is pretty low by default, but there are a few innocent mistakes that you can make and are worth fixing.
Define the Sizes of all Images and Videos
One small thing with a big impact. If you don’t explicitly define the size of the images and videos on your page, it can lead to a shift in the layout because the browser isn’t sure how much space to reserve for that resource.
This is as simple as adding the attribute for any image or video on the page:
<img src="hero_image.jpg" width="400" height="400">
Avoid Ads and Pop-ups That Cause Layout Shifts
You’ve got to pay the bills somehow, but avoid using pop-ins or pop-ups that shift the page layout. If nothing else, use a CSS aspect ratio box to “reserve” space for ads or other messages loading into the page as the user interacts.
Choose Animations Wisely
With modern CSS and JavaScript, we can implement all kinds of cool and fancy animations on the page.
But, from a user’s perspective, function always trumps form.
Remove any animations that trigger layout changes, since each change of state can contribute to the overall layout shift and ding your CLS score.
#5 – Interaction to Next Paint (INP)
As Jay-Z once said, “I’ve got no patience. And I hate waiting.”
Don’t we all?
While we’ve already covered the input delay on the first interaction with your website (FID), INP is a broader metric that assesses your website’s overall responsiveness.
What is Interaction to Next Paint?
Interaction to Next Paint measures how long it takes for the next “paint” or updated frame on your website to appear after the user interacts with a button or page element. It measures overall website responsiveness and how fluid the interactions feel.
This is especially important for web apps that require significant user interaction and can feel sluggish and confusing if there’s too long of an input lag or delay between the action and the outcome.
INP is measured in milliseconds:
- Good: < 200ms
- Needs Improvement: 200 – 500ms
- Poor: > 500ms
Techniques to Improve INP
If you’re having INP problems, I feel bad for you, son. (Sorry, that’s another Jay-Z lyric.)
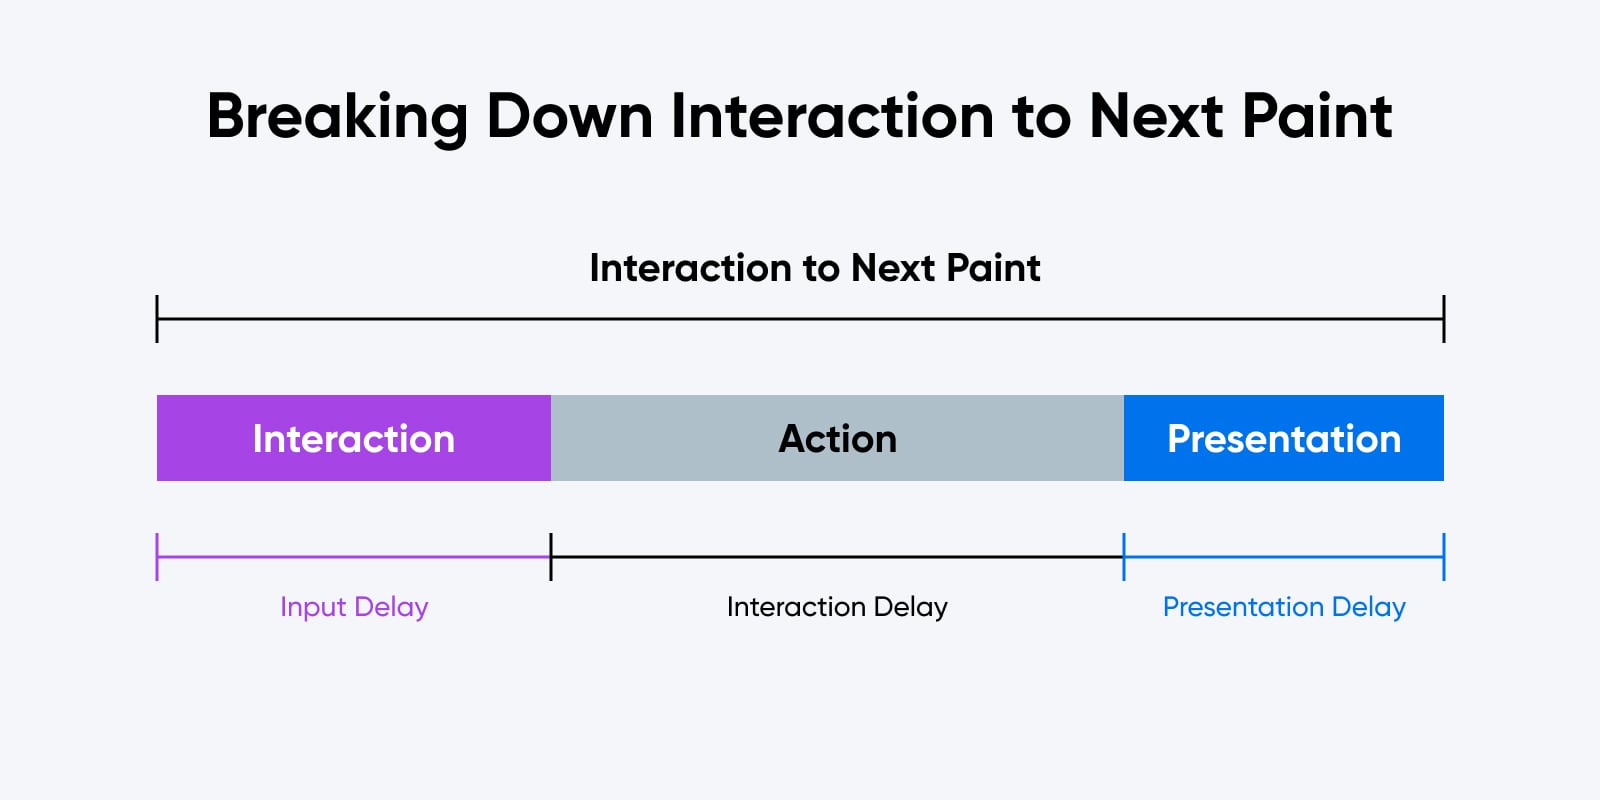
Luckily, you can break down most issues into three main problems:
- Input delay
- Interaction delay
- Presentation delay
This is the really tricky part; To diagnose the issue more closely, you’ll need to either use Google Chrome performance profiler or Lighthouse’s record functionality.
Here you can zoom in on an individual interaction and see where the longest delay occurs.
From there, we can look for some solutions to each one.
Fixing Input Delay
Input delay is caused when the main thread is busy at the time of the interaction. This means something else is happening when the click or keypress takes place.
To fix it, you’ll want to dig into which processes are running as part of the main thread:
- Remove or optimize third-party JavaScript.
- Use web workers to run JavaScript outside of the main thread.
- Use listeners like isInputPending() to yield the main thread (this is the most advanced option.)
Fixing Interaction Delay
If the interaction itself is the culprit – meaning it takes a long time for the interaction to actually execute – then you’ll need to refactor the code for this input.
The main recommendation here is to defer non-essential computations.
In other words, execute the part of the interaction that the user immediately sees and expects. Then, after updating the frame, perform any other calculations or interactions behind the scenes.
Say, for instance, that the user clicks a button that opens a window and also logs an event showing that they clicked the button. You would want your code to open the window first, “completing” the interaction from the perspective of the user.
Then, once the interaction is completed, log the event that the user won’t see or experience directly.
Fixing Presentation Delay
It’s possible that the input and the interaction are both happening pretty quickly, but it’s taking a long time for the browser to update the presentation with the new frame.
Unfortunately, there isn’t a lot of refactoring that will help with this.
But a few things could cause a longer-than-normal delay:
- Overuse of requestAnimationFrame(). Each time this function is called, it creates a tiny delay. So look for cases where it may be used too frequently or unnecessarily.
- “Async” attributes run awry. Depending on the context, some resources you’ve marked for async rendering might ignore the directive or load unexpectedly. If that happens, it will delay other render path items and the next frame.
#6 – Time to First Byte (TTFB)
Now, we find ourselves thinking about that very first instant when a webpage loads.
Before the page can even start to render, the user’s browser needs to make contact with the web server, figure out who it’s connecting to, and get marching orders about what to start loading in what order.
That initial handshake contains the first byte of information. How quickly that byte arrives is like the pistol shot at the start of a horse race.
What is Time to First Byte?
Time to First Byte is the time it takes your browser to go through processes like DNS lookup, TCP and SSL handshakes, and connection setup in order to request – and receive – the first bytes of information from a web server. The speed of establishing connection with the web server is almost entirely dependent on the server itself and how the website is hosted.
It’s measured in milliseconds:
- Good: < 800ms
- Needs Improvement: 800 – 1800ms
- Poor: > 1800ms
Techniques to Improve TTFB
You can think of TTFB as the time you spend at the starting line before the pistol is fired. Anything that delays the initial greenlight will add time to TTFB and the overall page load time.
So what are your options for improvement?
Eliminate Redirects
First and foremost, eliminate page redirects whenever possible. If you’re redirecting users from one page to another, the time it takes to execute falls within the TTFB window, which means you’ll add a significant amount of time to your score.
This includes 301 redirects from old URLs to a new one, as well as temporary redirects and other implementations.
Upgrade Your Web-Hosting
Hosting plays a huge role in your website’s overall speed and performance score, especially when it comes to TTFB.
Hosting Provider
A hosting provider is a business that charges a fee in exchange for “renting” server space and resources. You can choose any hosting provider that you want to launch a new website.
Read MoreYou’ll want to look at the specifics of your web hosting provider, paying close attention to things like:
- Shared vs dedicated hosting: Is your website hosted on its own instance or is it sharing resources with other users and their websites? Dedicated hosting usually costs more but provides more consistent performance.
- Memory (RAM): The memory your site can access on the server plays a major role in its overall performance. If the memory is maxed out, then the server won’t be able to process and respond to new requests.
- CPU / Processor: The speed of the server’s processor also plays a role in its response speed and processing time.
- Infrastructure updates: Is the software running on the server kept up to date and free of errors or conflicts? Update the latest versions of PHP, MySQL, and other essential applications to maximize performance.
Implement Caching
On so-called “dynamic websites,” like sites running on WordPress, caching your pages can make huge improvements to page load times and TTFB.
Caching essentially means that rather than fetching information from your site’s database each time a page is loaded, the site will store a copy of the page and serve that up to the user. It’s much faster than looking up information each time.
For a breakdown on how this works, read our guide to website caching.
A Note About Speed Index
We didn’t include a separate section focused on the Speed Index metric in this guide because that’s essentially measuring the overall load time of the page.
This means that addressing Speed Index issues is usually a matter of tackling the other related metrics we’ve already covered:
- First Contentful Paint
- Largest Contentful Paint
- Interaction to Next Paint
- Time to First Byte
Each will play a small role in the cumulative page speed and addressing them directly should improve your overall Speed Index score.
Final Thoughts on PageSpeed Insights
In this guide, we’ve covered just about everything there is to know about the PageSpeed Insights report and how you can strategically address each potential problem.
Altogether, I expect that page performance, accessibility, and technical best practices will continue to grow in importance. We’re building the web together – one website at a time – and that relies on us all investing in keeping the web open, accessible, and beautiful.
Take Charge with Flexible VPS Hosting
Here’s how DreamHost’s VPS offering stands apart: 24/7 customer support, an intuitive panel, scalable RAM, unlimited bandwidth, unlimited hosting domains, and SSD storage.